Entry Points to NASA Science Data
NASA collects vast quantities of data about stars, planets and other objects, the Sun, our Earth, and even cells! This information is stored in a number of topical archives. Here we collect together some places where you can begin to explore NASA data; primarily through resources that are accessible with just a web browser. Start your data exploration below.
Explore by Science Discipline
Table 1 Collections that include data from all disciplines
Resource Name | Short description | Science topic(s) | Data Skill Required |
NASA's Scientific Visualization Studio produces visualizations, animations, and images in order to promote a greater understanding of Earth and Space Sciences. We work closely with scientists — both within the NASA community, and within the broader academic research community — to create high-quality, data-backed visualizations. | All | Introductory | |
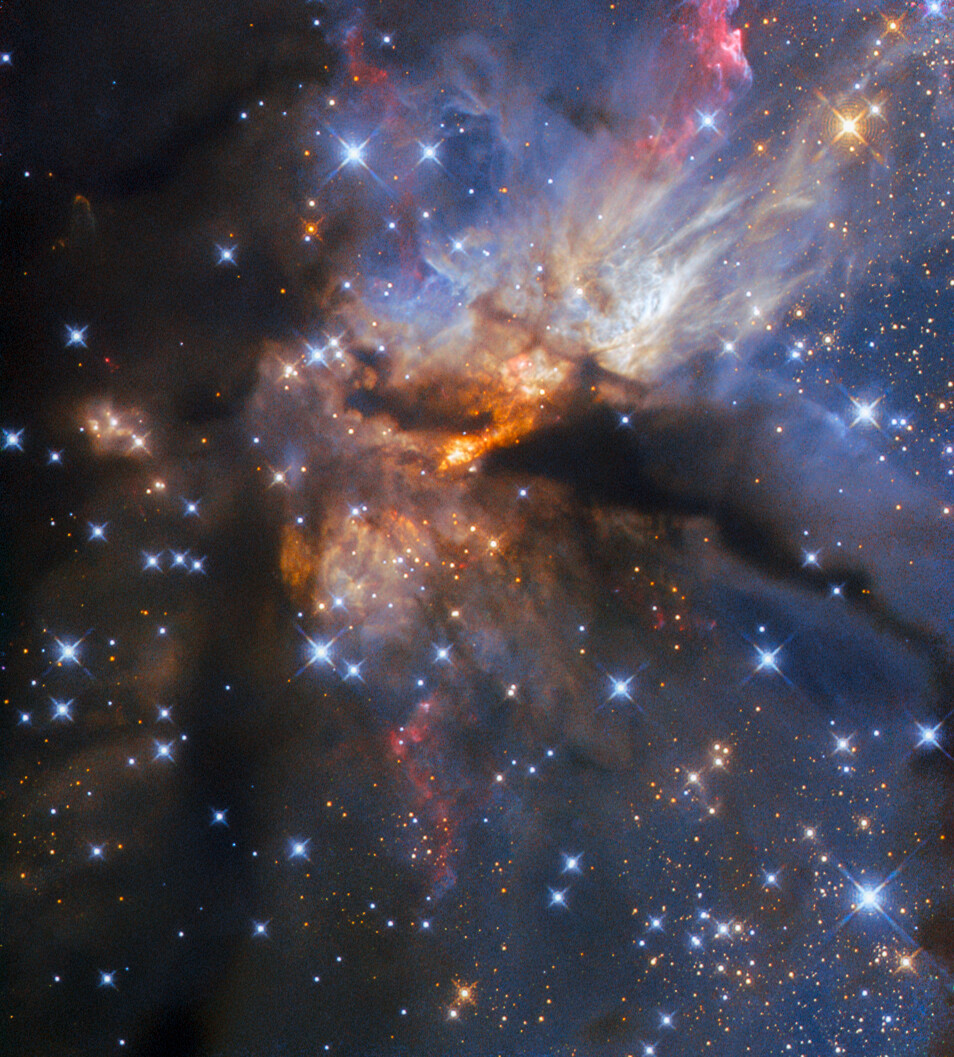
Mini Data Stories showcase new science imagery in an interactive view powered by WorldWide Telescope. Ideas for exploration and scientific highlights are shared in a brief video and narrative text. | Star-forming nebulae, Solar system objects, Supernovae | Intermediate | |
Open-source interactive data visualization software designed to visualize the entire known universe and portray our ongoing efforts to investigate the cosmos. Compatible across platforms from laptops to planetarium domes. | Astrophysics, Planetary Geology, Mission Engineering, Earth system | Intermediate | |
Empowering open science, the Science Discovery Engine allows you to explore the universe, from the tiniest of cells to the vastness of space, through discovery of NASA's science data, documentation, and code. | All | Advanced | |
The purpose of the Science Data Archives list is to provide NASA Science data stakeholders with a comprehensive list of NASA Science data archives to increase data accessibility. Earth, heliophysics, planetary, and astrophysics observations and data are freely accessible to all | All | Advanced | |
Datasets from a variety of research projects at the NASA Goddard Institute for Space Studies | Climate, Astrophysics, Planets, Exoplanets, Astrobiology, Temperature, Aerosols, Clouds, Occeas, Precipitation, Radiative Flux, Storms | Advanced |
Table 2 - Astrophysics Data
Resource Name | Short description | Science topic(s) | Data Skill Required |
Much of our Universe is too distant for anyone to visit in person, but we can still explore it. Telescopes give us a chance to understand what objects in our Universe are like in different types of light. By translating the inherently digital data (in the form of ones and zeroes) captured by telescopes in space into images, astronomers can create visual representations of what would otherwise be invisible to us. But what about experiencing these data with other senses, like hearing? Sonification is the process that translates data into sound. Our new project brings parts of our Milky Way galaxy, and of the greater Universe beyond it, to listeners for the first time. | Milky Way, Universe | Introductory | |
Using data from NASA's Chandra X-ray Observatory and other satellites on exploded stars, star-forming regions, and black holes, you'll learn basic coding. By following the video tutorials below, you will see just how integral coding is in the pursuit of learning about our Universe. It's an example of the exciting ways that computer science is both part of routine tasks in our every day lives and part of the exciting quest to explore the cosmos. | Milky Way, Universe | Introductory | |
Eyes on Exoplanets lets you explore all known and potential exoplanet systems visually, as well as sorting by discovery mission, observatory. Updated multiple times a day. Highlighted stars are known to have, or have good prospects for, orbiting exoplanets. Once you click the ‘Explore Now’ button below, you will be able to select any of the highlighted stars to learn more about these confirmed planets and compare them to our solar system or navigate through the filters. | Exoplanets | Introductory | |
Images from telescopes around the world and in space are now at your fingertips. AstroPix is a new way to explore and share the universe. | Astronomical objects | Introductory | |
Try your hand at processing images from NASA's space telescopes, or capture and process your own! | Astronomical objects | Intermediate | |
The Cosmic Data Stories (CosmicDS) project promotes public understanding of data science through engaging, interactive data stories. | Cosmology, Galaxies | Intermediate | |
Web-based interactives support middle school and high school learning in space science, covering the solar system, the life cycle of stars, and evidence for the Big Bang and expansion of the universe. | Solar System, Stellar Evolution, Cosmology | Intermediate | |
When scientists combine data from the Chandra X-ray Observatory with other telescopes, such as the Hubble or Spitzer space telescopes, or with scientific and mathematical models, we can create data-driven 3D maps of objects in our universe, such as stars that have exploded. This activity series will take you through the basics of 3D modeling in astronomy using the free browser-based software Tinkercad. | Cosmic objects | Intermediate | |
Acquire and analyze MicroObservatory robotic telescope observations of transiting exoplanets, using the same tools and techniques that professional astronomers use to generate transit light curves. Users can contribute their data to Exoplanet Watch to help professional astronomers refine the orbital periods of previously detected exoplanets and exoplanet candidates. | Exoplanets | Intermediate | |
MicroObservatory is a network of automated CCD imaging telescopes that can be controlled over the internet, along with associated image analysis tools and resources for personal investigations. The telescopes were developed by scientists and educators at the Harvard-Smithsonian Center for Astrophysics, and are designed to enable youth nationwide to investigate the wonders of the deep sky from their classrooms or after-school centers. They are located and maintained at observatories affiliated with the Center for Astrophysics, including the Harvard College Observatory in Cambridge, Massachusetts, and the Whipple Observatory in Amado, Arizona. | Astronomical objects | Intermediate |
Table 3 Biological and Physical Science Data
Resource Name | Short description | Science topic(s) | Data Skill Required |
Growing Beyond Earth® (GBE) is a classroom-based citizen science project operated in partnership with NASA, designed to advance NASA research on growing plants in space. It includes a series of plant experiments conducted by students in a Fairchild-designed plant habitat similar to the Vegetable Production System (Veggie) on the International Space Station. | Plants in space | Introductory | |
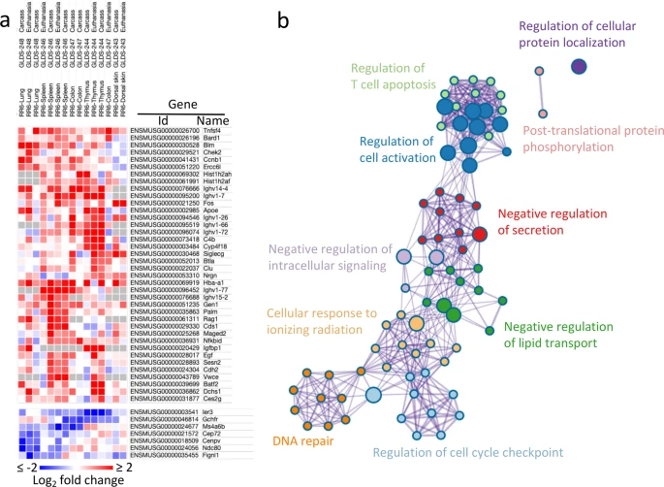
Open Science Data Repository (OSDR) | OSDR enables access to space-related data from experiments and missions that investigate biological and health responses of terrestrial life to spaceflight. OSDR maximizes the scientific return from NASA-funded research, encourages community participation in the analysis of data toward new discoveries, has space-relevant tissues available for scientific request, and offers the world reusable space life science data so the public can be involved in the quest for space exploration. OSDR is designed to help scientists discover and access datasets to perform primary, secondary, and meta-analyses. Established in 2022, OSDR was an integration of three NASA repositories to support NASA’s commitment to the principles of Open Science, open data, and sharing: the Ames Life Sciences Data Archive (ALSDA), GeneLab, and the NASA Biological Institutional Scientific Collection (NBISC). | Space Life Science Data, Including Multi-Omics (e.g. Transcriptomics, Metagenomics, Epigenomics, Proteomics, Metabolomics), Space-Stressor Effects on Biology (e.g. Microgravity, Radiation), Phenotypes, Physiology, Behavioral Research, Environmental Telemetry, Bioimaging, Biospecimens | Intermediate, Advanced |
PSI is an online database of completed physical science reduced-gravity flight experiments conducted on the International Space Station and other platforms, as well as related ground-based studies. Each research area is represented through a variety of data types, including raw and analyzed data, imagery, science requirements, experiment design and engineering data, analytical and numerical models, publications, reports, patents, and commercial products developed from the research. The PSI system is accessible and open to the public, providing the opportunity to data mine results from prior flight investigations and expand on the research performed. | Biophysics, Combustion Science, Soft Matter/Complex Fluids, Fluid Physics, Fundamental Physics, Material Science | Advanced |
Table 4 Earth Science Data
Resource Name | Short description | Science topic(s) | Data Skill Required |
Vital signs of the Planet (A static data sheet version of these data is also available for classroom and other uses.) | CO2, Temperature, Methane, Arctic Sea Ice, Ice Sheets, Sea Level, Ocean Warming | Introductory | |
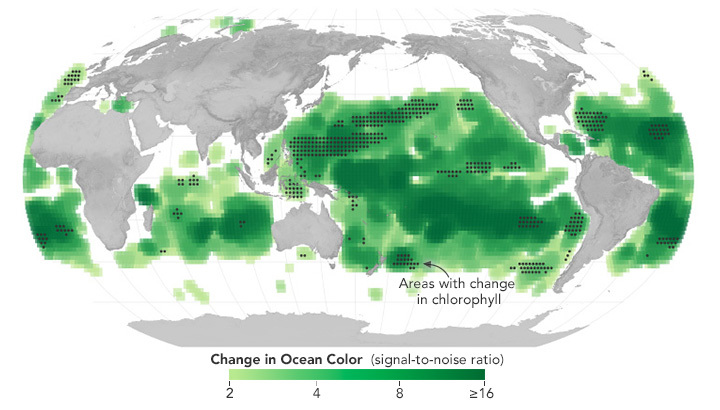
One of the best places to study Earth is from space. NASA satellites continually orbit the globe, collecting information about Earth’s ocean, atmosphere, and land surfaces. Satellites can even monitor the activity of life forms, such as phytoplankton, from their remote vantage points. NEO strives to make global satellite imagery as accessible as possible. Our mission is to help you picture climate and environmental changes as they occur on our home planet. Here you can browse and download imagery of satellite data from NASA's constellation of Earth Observing System satellites. Over 50 different global datasets are represented with daily, weekly, and monthly snapshots | Atmosphere, Energy, Land, Life, Ocean | Introductory | |
Monitor our planet's vital signs, see where Earth Observing satellites orbit in real-time, and explore current Earth events and visually explore the latest datasets. | Temperature, Carbon Dioxide, Carbon Monoxide, Precipitation, Sea Level, Soil Moisture, Salinity, Ozone, Water Vapor, Water Storage, Atmospheric Chemistry | Introductory | |
Observations to the GLOBE Observer Clouds module are automatically matched to satellite data where available. This provides a great local starting point to explore NASA data for one's local area. | Clouds | Introductory | |
A map-based tool to find georeferenced Earth imagery taken by astronauts | Earth imagery | Introductory | |
Discover Earth as NASA sees it | All Earth, planetary change | Introductory | |
NASA offers petabytes of global Earth science data collected from satellites but accessing these data in a traditional (or virtual) science classroom can be tricky. Since 2004, My NASA Data has supported students and teachers of grades 3-12 in analyzing and interpreting NASA mission data. Join My NASA Data as we strive to support your integration of authentic Earth data in your instruction. | Atmosphere, Biosphere, Cryosphere, Geosphere, Hydrosphere, Earth as a System, Solar Eclipse | Introductory, Intermediate | |
FIRMS US/Canada is a joint effort by NASA and the USDA FOREST SERVICE to provide access to satellite imagery and science data products to identify the location, extent and intensity of wildfire activity and its effects. | Active fires, hotspots, burned area, smoke plumes, fire perimeter | Introductory, Intermediate | |
Worldview is a mapping and data visualization tool which allows users to interactively browse over 1,000 global satellite imagery layers made available within minutes to hours of satellite acquisition and imagery that spans more than two decades. | Global Earth science data, disasters , nighttime lights | Introductory, Intermediate | |
Vertex is a powerful, yet easy-to-use graphical interface for finding, accessing, and downloading synthetic aperture radar (SAR) data. Vertex also provides on-demand SAR data processing | Synthetic Aperture Radar, sea ice, polar processes, geophysics | Intermediate, Advanced | |
Data Pathfinders guide users through the process of selecting application-specific datasets and learning how to use them through intuitive tools, facilitating equal and open access to the breadth of NASA Earth science data. The pathfinders are intended to familiarize users with and provide direct links to the applicable, commonly-used datasets across NASA’s Earth science data collections. After getting started here, there are numerous NASA resources that can help develop one’s skills further. | Air Quality, Agriculture, Ecological Conservation, Diseases, Greenhouse Gases, Water Management, Biological Diversity, Disasters, Sea Level Change, Water Quality | Intermediate | |
NASA’s Fire Information for Resource Management System (FIRMS) provides access to global satellite imagery, active fire/hotspots, and related products to identify and monitor fires. FIRMS tools and services are designed to support the broader fire management community, and to inform the general public. Global data are available within 3 hours of satellite observation; U.S. and Canada active fire detections are available in real-time. | Active fires, hotspots, burned area, smoke plumes | Intermediate, Advanced | |
View, graph and export GLOBE data from around the world with the GLOBE Visualization System. Users can use our various filters to find both contemporary measurements and historical data ranging back to 1995. Currently, this system supports a subset of GLOBE protocols, but new features are continually added so be sure to check back for our latest updates. | Atmosphere, Biosphere, Hydrosphere, Soil, Earth as a System | Intermediate | |
Find and use data with GLOBE's Advanced Data Access Tool. Users can refine searches using various parameters and then choose specific sites that contain the relevant measurements. | Atmosphere, Biosphere, Hydrosphere, Soil, Earth as a System | Intermediate | |
VEDA (Visualization, Exploration, and Data Analysis) is NASA's open-source Earth Science platform in the cloud. | Earth Science, Environmental Justice | Intermediate | |
The purpose of the Global Modeling and Assimilation Office (GMAO) Framework for Live User-Invoked Data (FLUID) is to provide applications for interactive analysis and visualizations of experimental, climatological data in support of the GMAO mission. | Weather analysis and forecasts | Intermediate | |
The NASA Flooding Analysis Tool was developed to allow practitioners and decision-makers to assess how sea level rise and other factors will affect the frequency of high-tide flooding in coming decades on a location-specific basis. The tool allows users to view sea-level observations and assess past high-tide flooding frequency, view future changes in high-tide flooding frequency under the Interagency Sea-Level Rise Scenarios, and view statistics and inflection points that support decision making. The flooding projections are based on an analysis of astronomical tides and other natural fluctuations in tide gauge data in combination with sea level rise projections based on climate models. | Sea Level | Intermediate | |
The Interagency Sea Level Rise Scenario Tool allows practitioners and decision-makers to view the data presented in the 2022 U.S. Interagency Taskforce Report. This includes sea level scenarios, projections, and individual process contributions anywhere in the ocean or at a selected tide gauge. The tool is intended to inform coastal communities and others about current and future sea level rise to help contextualize its effects for decision making purposes. | Sea Level | Intermediate | |
The NASA Sea Level Projection Tool allows users to visualize and download the sea level projection data from the IPCC 6th Assessment Report (AR6). Sea level projections considering only processes for which projections can be made with at least medium confidence are provided, relative to the period 1995–2014, for five Shared Socioeconomic Pathway (SSP) scenarios and five different future Global Mean Surface Temperatures (from 2080-2100). The goal of this tool is to provide easy and improved access and visualization to the consensus projections, the individual contributions of sea level rise, and projected timing of sea level rise milestones. | Sea Level | Intermediate | |
In the Sea Level Evaluation and Assessment Tool (SEA Tool), sea level trends resulting from different physical processes as measured by different observing systems are estimated and compared. This is done both globally and at specific tide gauges located around the world's coastlines. On global scales, sea-level measurements from satellites and profiling floats are used to produce maps of sea level trends from 1993 to 2019. At individual tide gauge locations, measured trends are interpreted in terms of the ocean, ice, and land drivers of relative sea-level change. This tool allows for an assessment of how well we understand recent sea level change and what is causing it. | Sea Level | Intermediate | |
The Application for Extracting and Exploring Analysis Ready Samples (AρρEEARS) offers a simple and efficient way to access and transform geospatial data from a variety of federal data archives. AρρEEARS enables users to subset geospatial datasets using spatial, temporal, and band/layer parameters. Two types of sample requests are available: point samples for geographic coordinates and area samples for spatial areas via vector polygons | All Earth | Advanced | |
The Earth Science Data Systems (ESDS) Program provides full and open access to NASA’s complete collection of Earth science data for understanding and protecting our home planet. | Earth system science | Advanced | |
This application allows you to visualize selected geophysical parameters. | Aerosols, Atmospheric Chemistry, Atmospheric Dynamics, Cryosphere, Hydrology, Ocean Biology, Oceanography, Water and Energy Cycle | Advanced | |
Panoply is a data visualization tool that works with netCDF, HDF, and GRIB file formats | Earth | Advanced | |
Provides solar and meteorological data sets from NASA research for support of renewable energy, building energy efficiency and agricultural needs. | Solar, Meteorology, Energy Efficiency, Agriculture | Advanced | |
Quickly access GLOBE data and filter it by various parameters with GLOBE application programming interface (API) calls. | Atmosphere, Biosphere, Hydrosphere, Soil, Earth as a System | Advanced | |
The CF Map tool is an interactive data visualization and download tool used in decision support for air quality applications and as a general research tool. It features interactive maps and spatial and temporal sub-setting over user requested domains. | Atmospheric Composition Air Quality | Advanced | |
A platform for accessing and producing biomass data | Biomass | Advanced |
Table 5 Heliophysics Data
Resource Name | Short description | Science topic(s) | Data Skill Required |
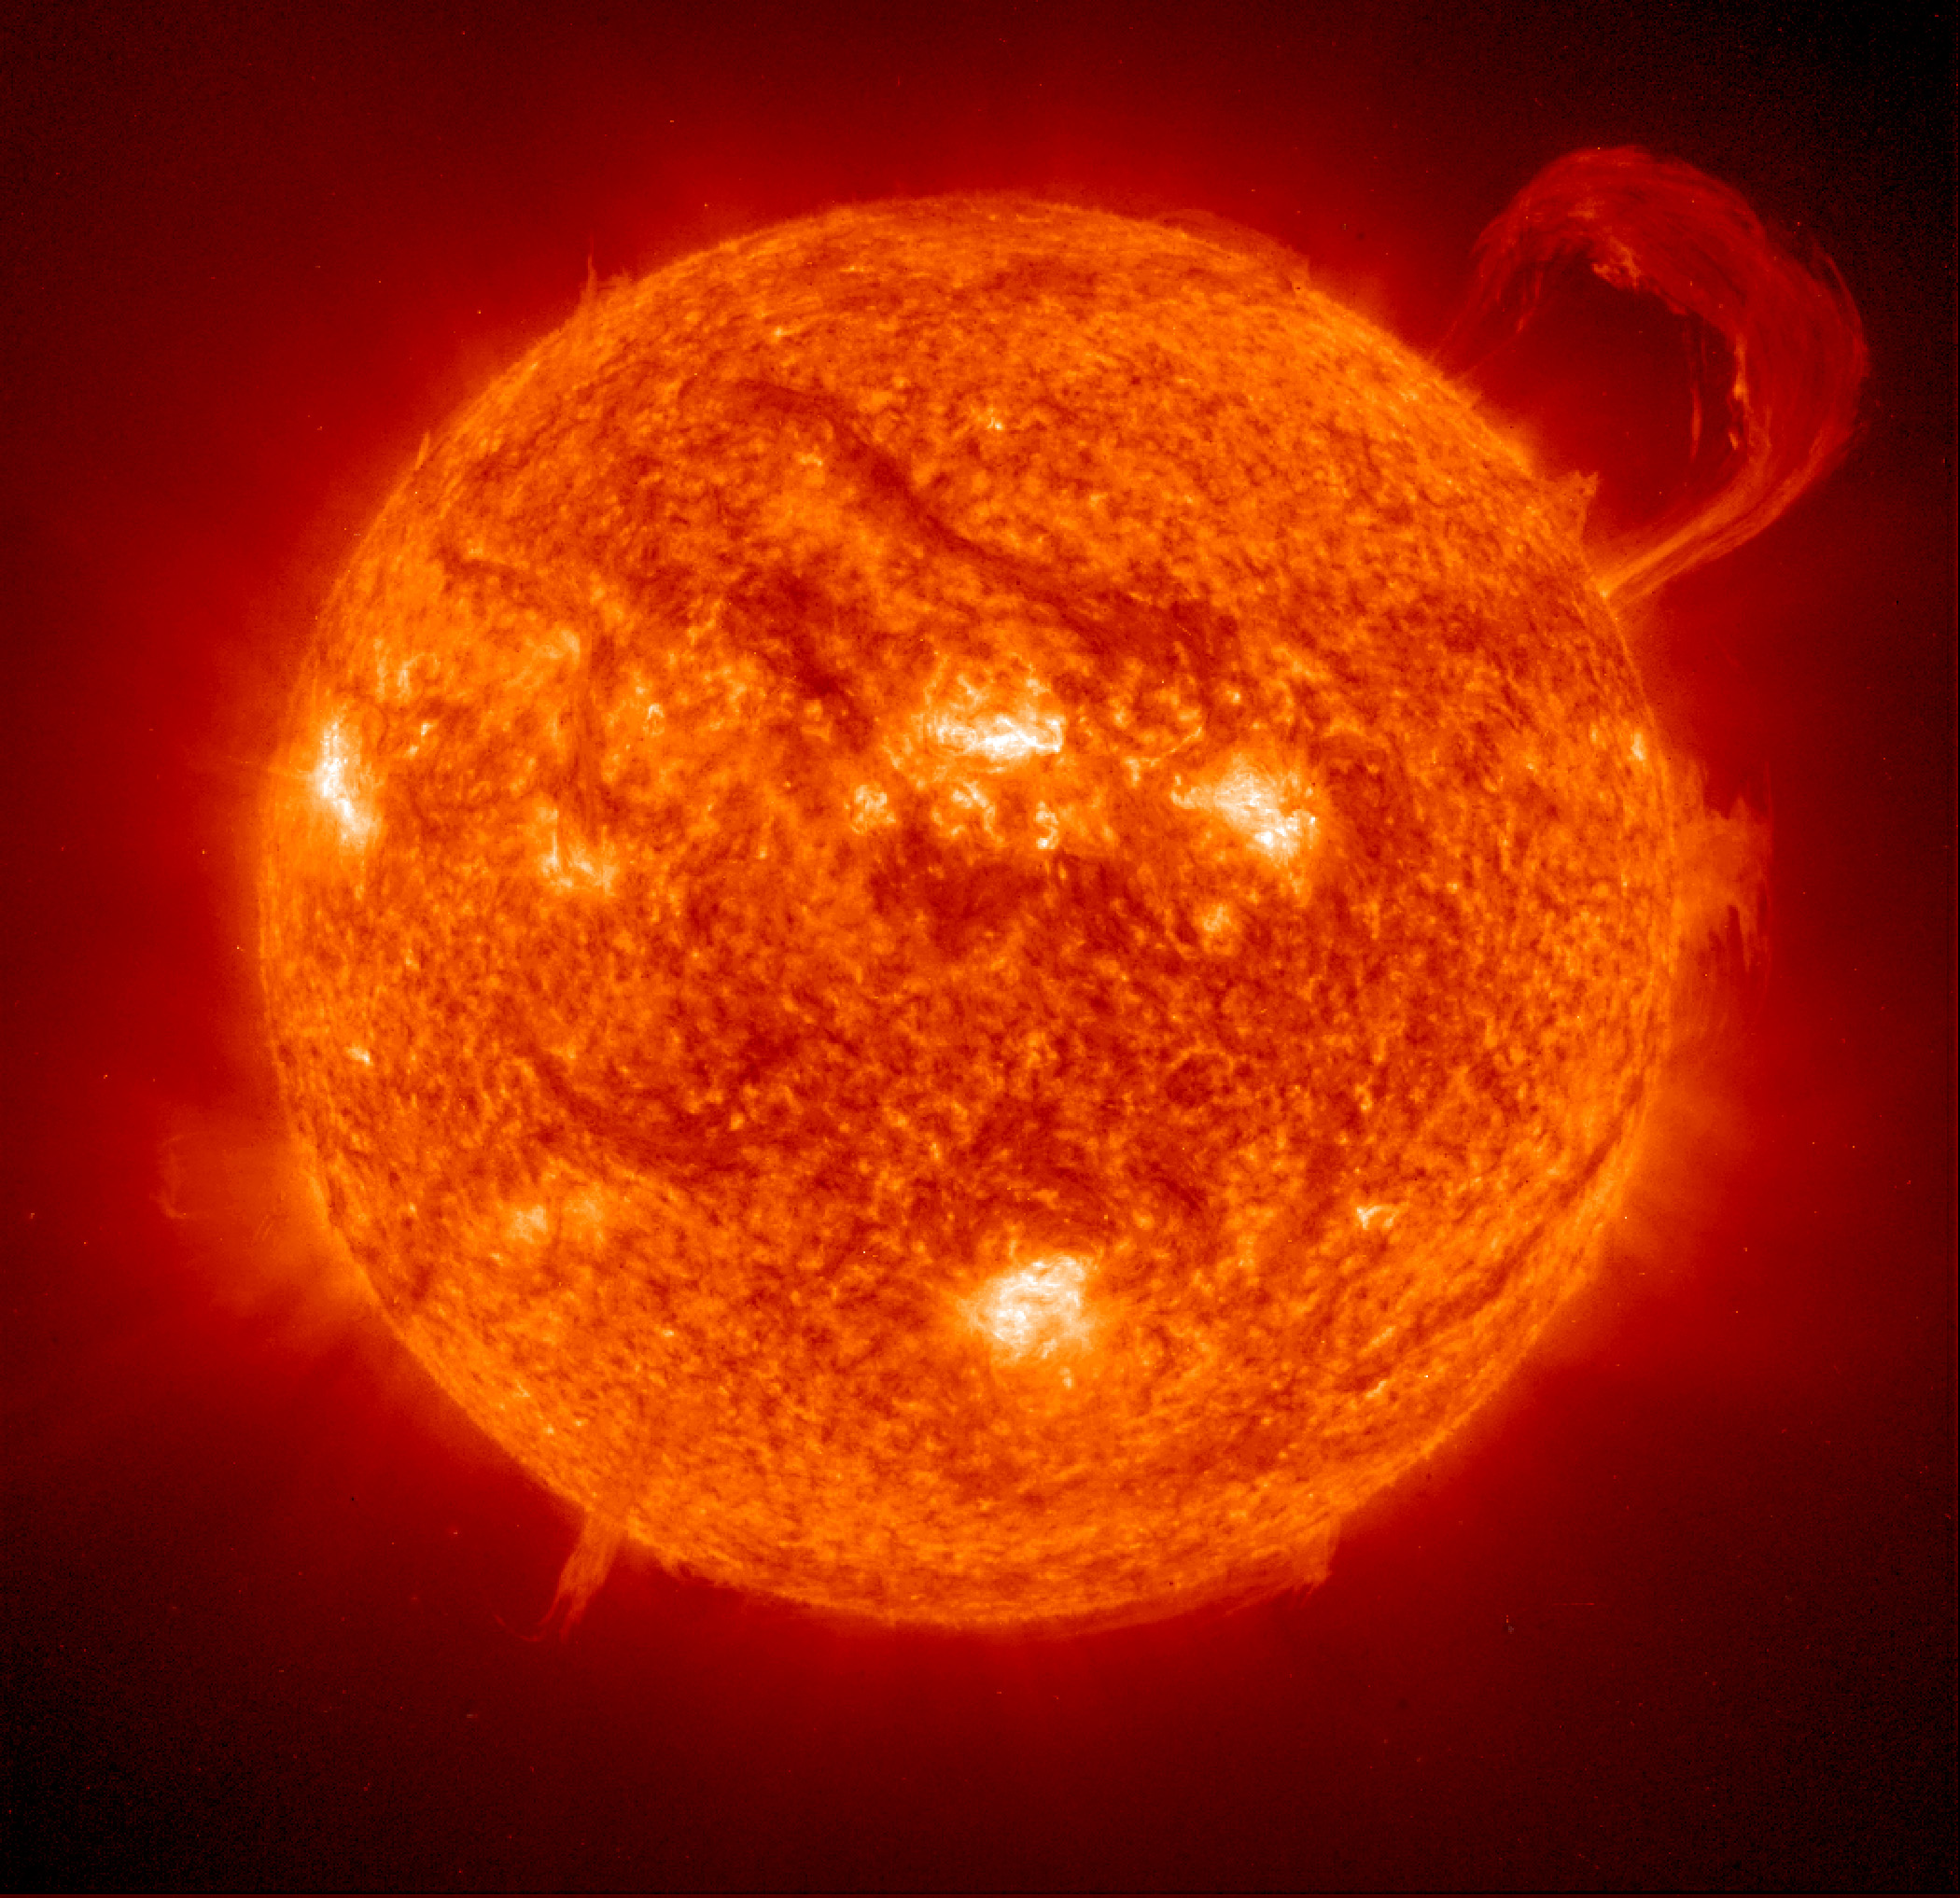
Helioviewer allows users to observe solar phenomena from over the last two decades up to near-real time and to create screenshots and movies. With this student version of Helioviewer, students can access authentic satellite data on solar features and events, including sunspots, flares, and active regions on the Sun’s surface; holes in the corona; eruptions, such as filaments and coronal mass ejections; and the Sun’s magnetic activity. | Sun | Introductory | |
Global magnetic field observations and products made possible by the contributors. | Magnetosphere, Space Weather | Intermediate, Advanced | |
The HP Data Portal provides a quick and easy way to find and access a comprehensive set of NASA and other datasets, images, movies, and associated services such as those for viewing orbits or doing simulations. Enter text searches, use standard lists of observatories, measurement types, etc., or simply scroll through the list. Use one search criterion or many. Then find concise product information and links for viewing plots, finding data files or delivery services, or accessing other services. The Data Portal is your one-stop guide to what you need. | Sun | Advanced | |
An open-source project for the visualization of solar and heliospheric data. | Sun | Advanced | |
The Space Weather Database Of Notifications, Knowledge, Information (DONKI) developed by the CCMC is a comprehensive on-line tool for space weather forecasters, scientists, and the general space science community. It chronicles the daily interpretations of space weather observations, analysis, models output, and notifications provided by the Moon to Mars Space Weather Analysis Office as a courtesy to the community. | Space Weather | Advanced | |
Data Portal for Downloading Solar Images and Data | Sun, Space Weather | Advanced | |
Free and open source data analysis software for solar physics data | Sun | Advanced | |
Browsing system for public non-solar heliophysics data from current and past heliophysics missions archived at Space Physics Data Facility (SPDF) https://spdf.gsfc.nasa.gov/ | Space Weather, Magnetosphere, Ionosphere, Thermosphere, Mesosphere | Advanced | |
Data and Services for the Heliophysics System Observatory | Sun, Heliosphere, Magnetosphere, Ionosphere, Thermosphere, Mesosphere | Advanced | |
Solar Dynamics Observatory Data | Sun, Space Weather | Advanced | |
The integrated Space Weather Analysis (iSWA) system developed by the Community Coordinated Modeling Center (CCMC) is a flexible Web-based dissemination system for NASA-relevant space weather information that combines forecasts based on the most advanced space weather models with concurrent space environment information. In addition to near real time observation data, iSWA also provides access to easy to understand continuous/real-time model output executed at the CCMC. Such information is extremely valuable to the community in understanding, monitoring, and forecasting the space environment for various purposes which can range from education to advanced research in near real-time or past time periods | Space Weather, all heliophysics domains | Advanced |
Table 6 Planetary Data
Resource Name | Short description | Science topic(s) | Data Skill Required |
Eyes on Asteroids visualizes in real-time all current Near-Earth Objects (32,000+) and Potentially Hazardous Objects (PHOs) as well as shows many historical asteroid and comet missions, with interactive "scrolly-telling" features. | Asteroids and Comets and NASA/ESA spacecraft missions in their entirety. | Introductory | |
This simulated view of the solar system allows you to explore the planets, their moons, asteroids, comets, and the spacecraft exploring them. You can also fast-forward or rewind time from 1950 to 2050. There are hundreds of places to visit and it is all using real data, images, engineering models, and events, just as they happened in space and time. | Planets, Moons, Asteroids, Comets, Spacecraft | Introductory | |
Your interface to the Planetary Image Archive (PIA) contained within the Planetary Data System Imaging Node. The home page graphic serves as a high-level entry point to the thousands of high-resolution images and their accompanying products which have been made available to the public from data returned by various JPL missions over the course of many years. Click on one of the planetary bodies to find images from that place. | Planets, Sun, Dwarf Planets, Small Bodies, Universe | Introductory | |
A virtual library for exploration and research of NASA's space rock collections | Meteorites, Moon | Intermediate | |
The Solar System Treks are online, browser-based portals that allow you to visualize, explore, and analyze the surfaces of other worlds using real data returned from a growing fleet of spacecraft. You can view the worlds through the eyes of many different instruments, pilot real-time 3D flyovers above mountains and into craters, and conduct measurements of surface features. The portals provide exciting capabilities for mission planning, planetary science, and public outreach. | Moon, Mars, Vesta, Ceres, Tita, Icy Moons, Mercury, Ryugu, Bennu, Europa, Venus, Ganymede | Intermediate | |
The Planetary Data System (PDS) is a long-term archive of digital data products returned from NASA's planetary missions, and from other kinds of flight and ground-based data acquisitions, including laboratory experiments. But it is more than just a facility - the archive is actively managed by planetary scientists to help ensure its usefulness and usability by the world wide planetary science community. | Atmospheres, Geosciences, Plasma Interactions, Ring-Moon Systems, Small Bodies | Advanced |


