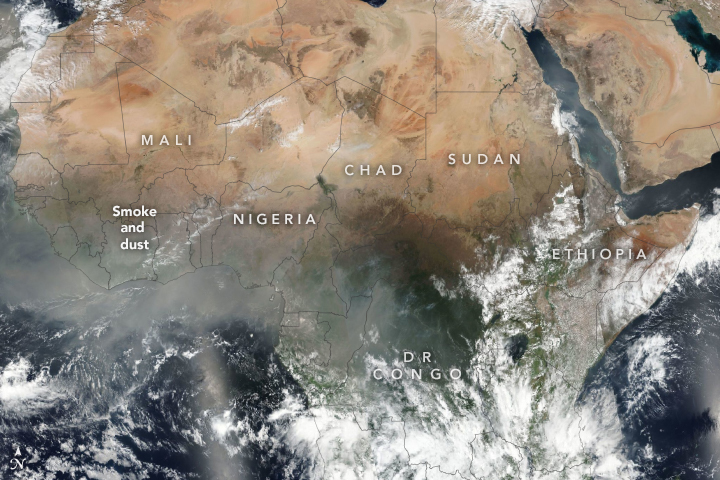
Aura's Ozone Monitoring Instrument (OMI) instrument can distinguish between aerosol types, such as smoke, dust, and sulfates, and measures cloud pressure and coverage, which provides data to derive tropospheric ozone.
OMI continues the TOMS record for total ozone and other atmospheric parameters related to ozone chemistry and climate. OMI measurements are highly synergistic with the other instruments on the Aura platform. OMI is a nadir-viewing wide-field-imaging spectrometer, giving daily global coverage. It provides mapping of pollution products from an urban to super-regional scale.
The instrument observes Earth's backscattered radiation with a wide-field telescope feeding two imaging grating spectrometers. Each spectrometer employs a CCD detector. Onboard calibration includes a white light source, LEDs, and a multi-surface solar-calibration diffuser. A depolarizer removes the polarization from the backscattered radiation.
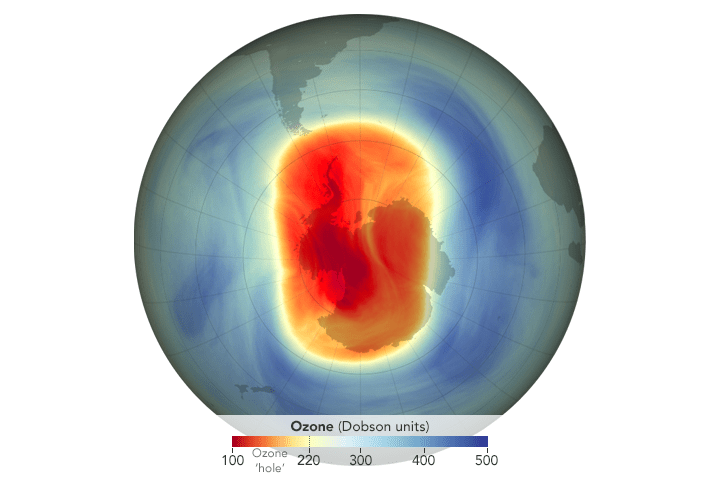
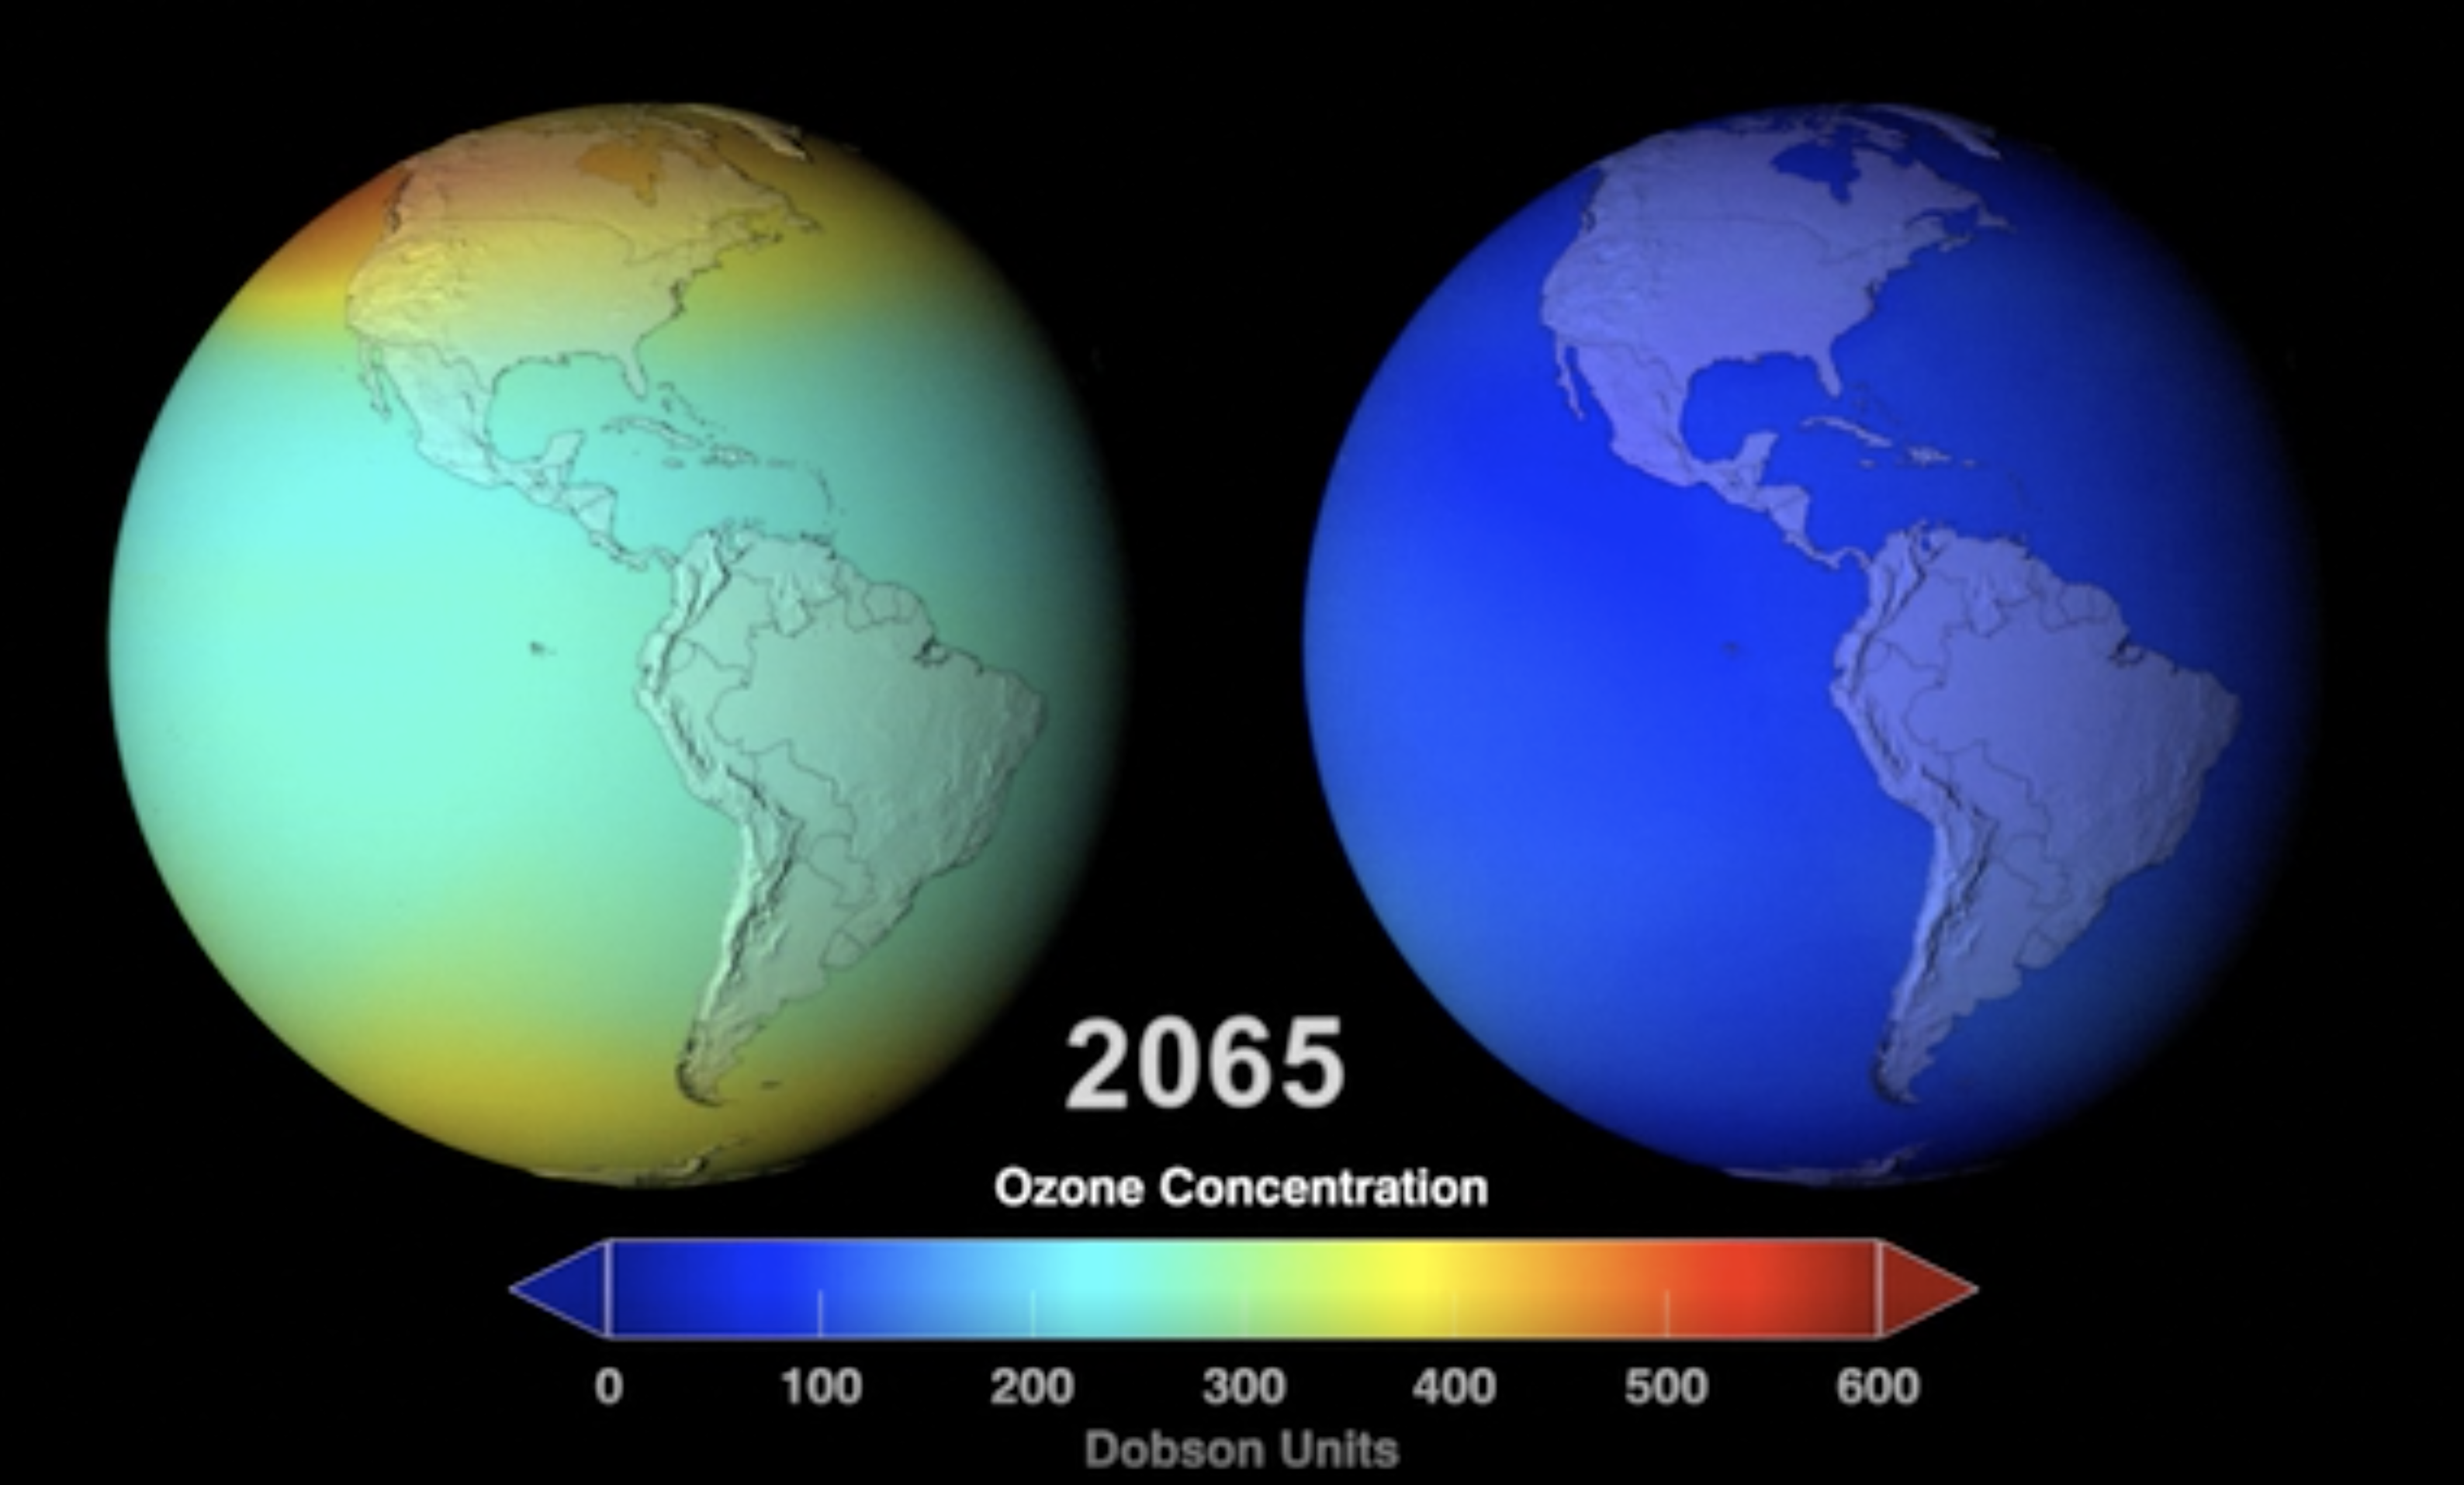
OMI has been monitoring the recovery of the ozone layer in response to the phase out of chemicals, such as CFCs, agreed to by the nations of the world in the Montreal protocol and later modifications to it at Copenhagen and London. OMI measures the total column amount of atmospheric ozone nitrogen dioxide as well as lower atmospheric dust, smoke, and other aerosols. OMI measures ozone profiles (in the UV) complementary to those measured by TES and HIRDLS (in the IR) and MLS (in the microwave). OMI measures bromine monoxide, formaldehyde, and chlorine dioxide which all play a role in chemistry of the stratosphere and troposphere.
OMI helps improve understanding and assessment of:
Total Ozone
OMI employs hyperspectral imaging in a push-broom mode to observe solar backscatter radiation in the visible and ultraviolet. The hyperspectral capabilities improve the accuracy and precision of the total ozone amounts and allow for accurate radiometric and wavelength self-calibration over the long term.
Read More
Pollution and Human Health
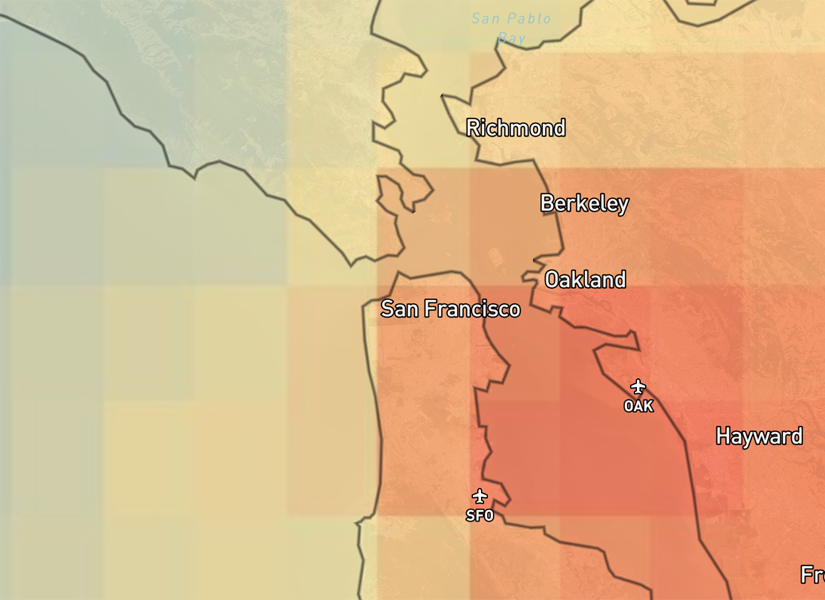
The US Environmental Protection Agency (EPA) designated atmospheric constituents such as ozone, nitrogen dioxide, sulfur dioxide, and aerosols pose serious threats to human health and agricultural productivity. OMI measurements of these pollutants are made at near urban scale resolution and track industrial pollution and biomass burning.
Read More
Volcanic Effects
OMI detects volcanic ash and sulfur dioxide produced in volcanic eruptions with up to at least 100 times more sensitivity than TOMS. These measurements are important for aircraft safety.
Read More


