Astronomers theorize that the early universe was very smooth, and that the distribution of matter was uniform with tiny variations in density that grew into a web-like pattern. These areas of slightly higher density also had slightly more gravity to attract more matter. Over time, the universe evolved into a web of filaments and vast sheets, largely made of dark matter, which form the structure of the universe today.
 Galaxy Cluster MACS J0717 Dark Matter MapNASA, ESA, Harald Ebeling (University of Hawaii at Manoa) & Jean-Paul Kneib (LAM)
This cosmic web forms the large-scale backbone of the universe. Hubble’s high resolution can make detailed observations that spot minute distortions in how light from distant objects bends around a foreground galaxy cluster. Such observations allowed astronomers to make the first map of a filament funneling matter into the massive galaxy cluster MACS J0717. The astronomers expanded Hubble’s two-dimensional observations by using data from other observatories that measured distances to the galaxies in the filament.
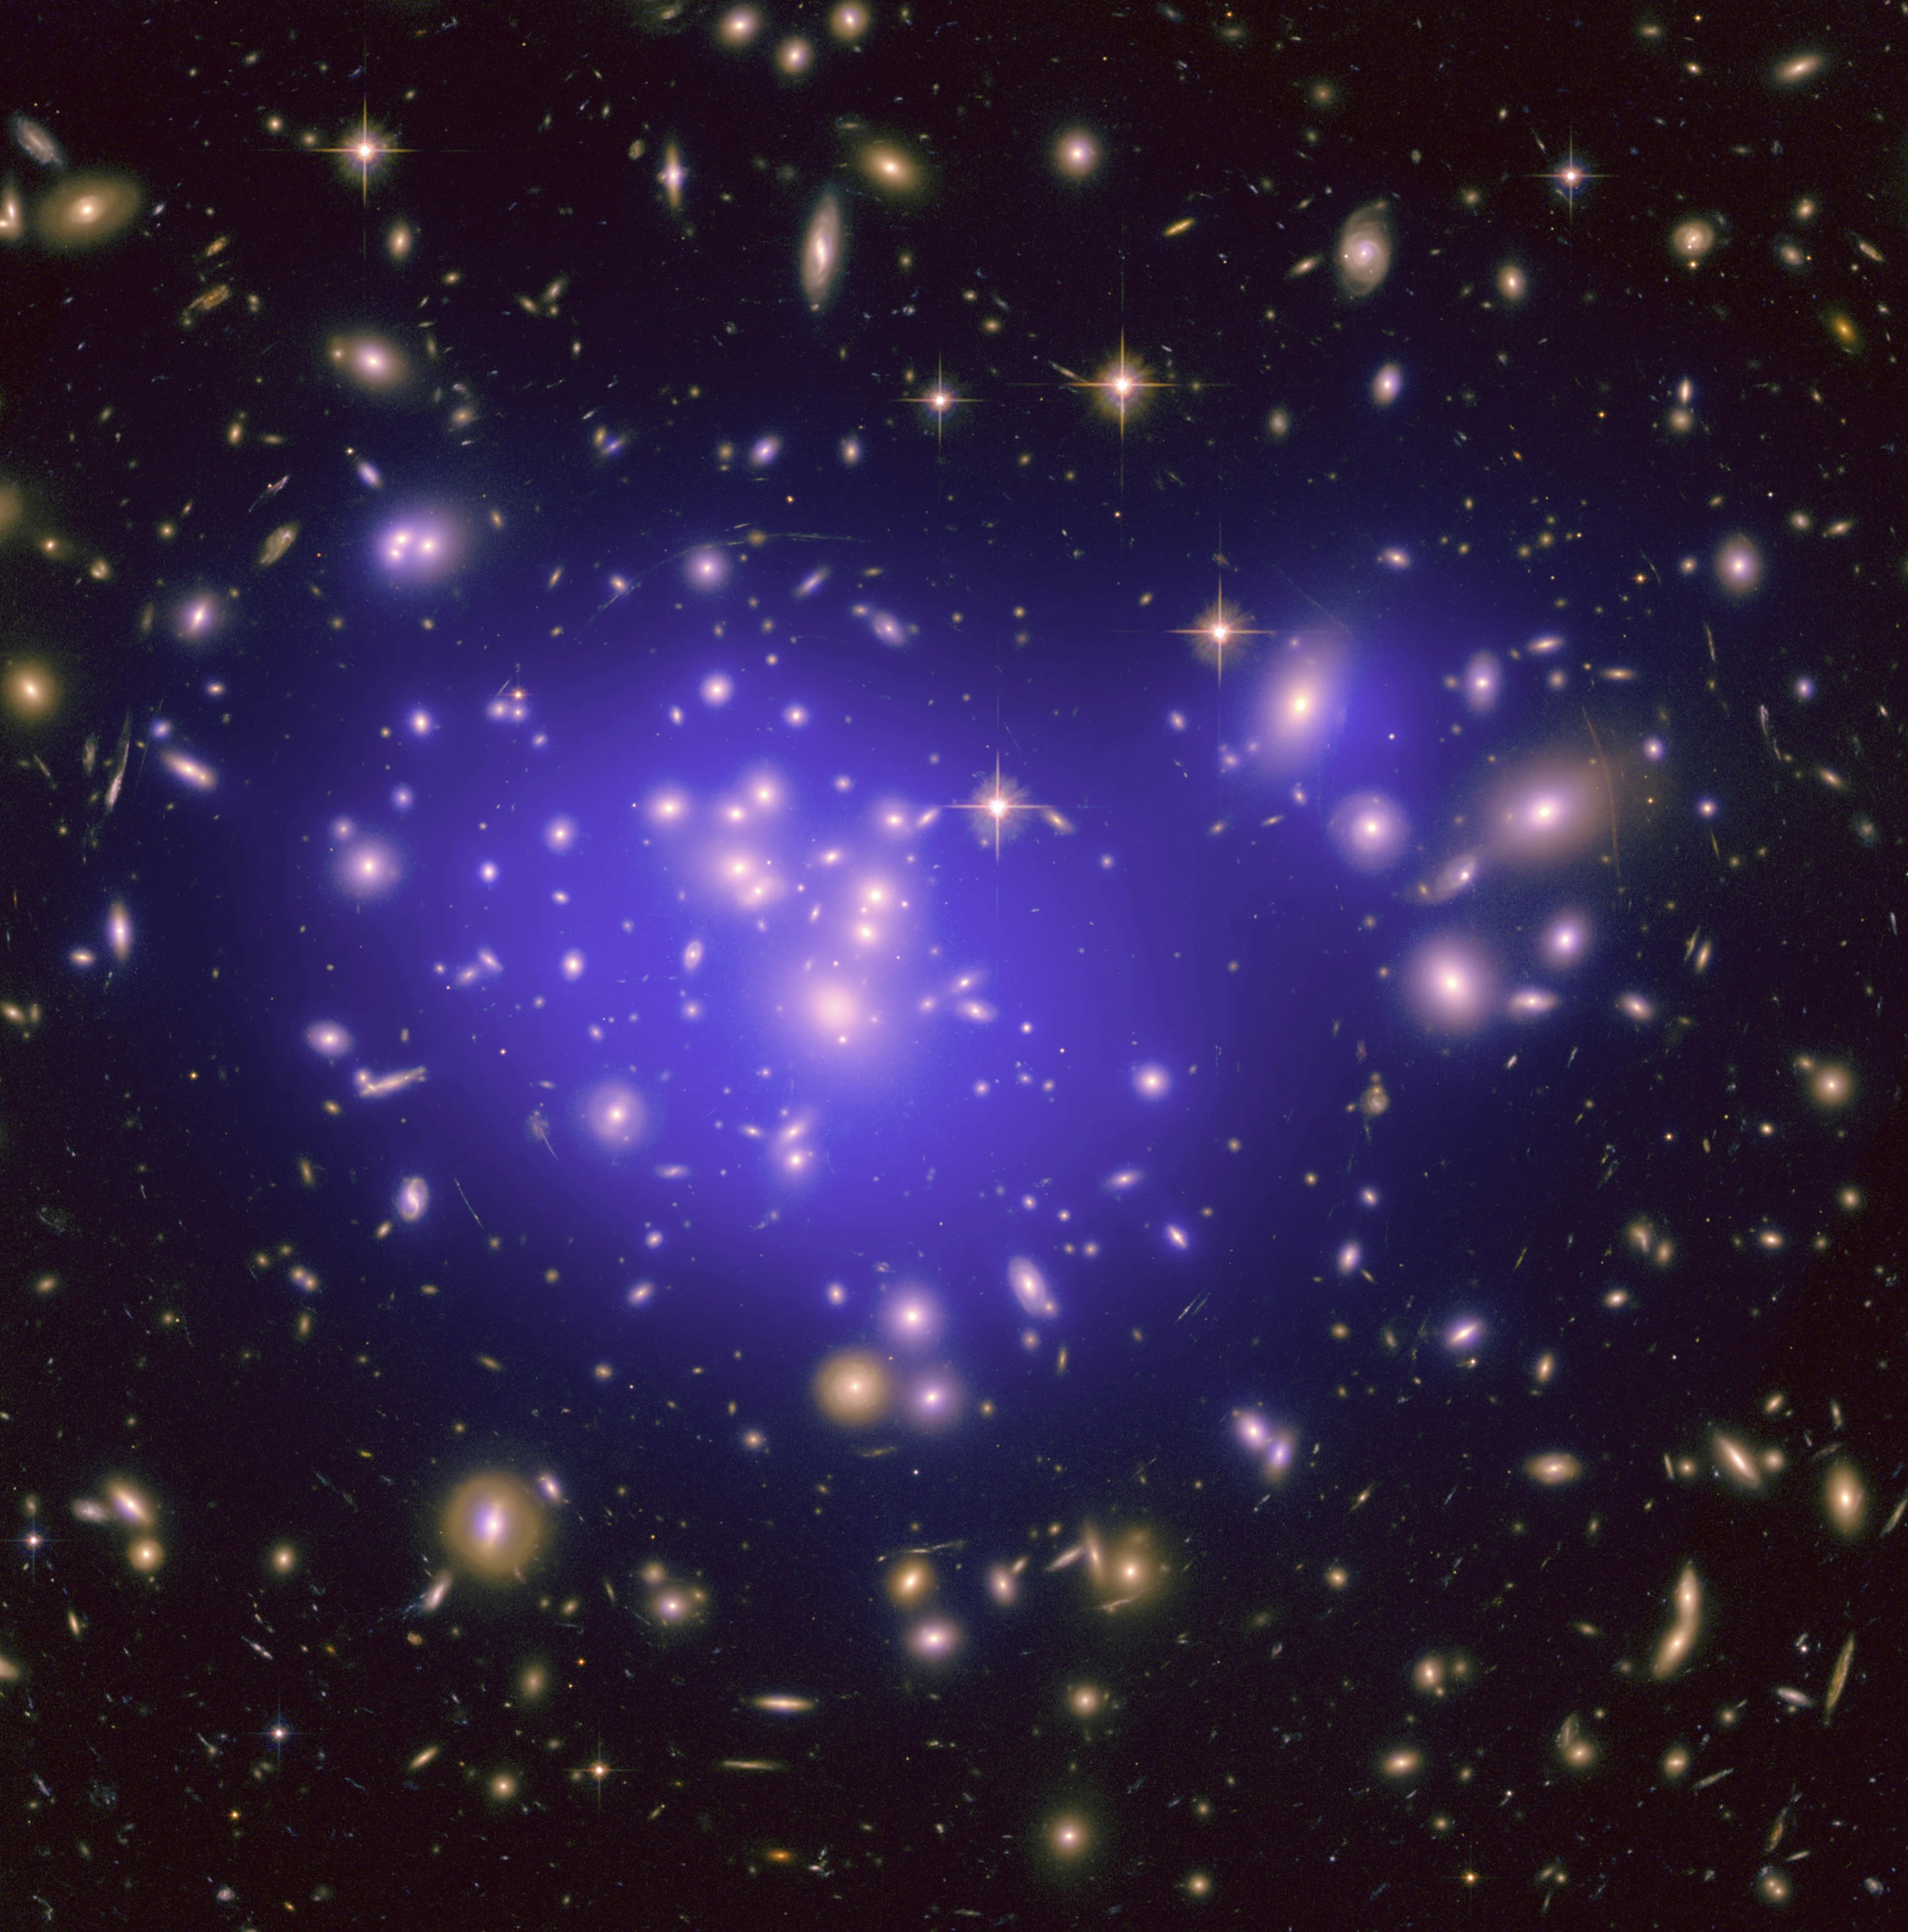
 Multiwavelength View of MACS J0717NASA, ESA, CXC, C. Ma, H. Ebeling and E. Barrett (University of Hawaii/IfA), et al. and STScI
Hubble observations of MACS J0717 and its filament also revealed the first documented collision of four separate galaxy clusters. The collisions are the result of the 13-million-light-year-long filament of normal and dark matter streaming into a region already full of matter.
This composite image of visible light data from Hubble and x-ray data from NASA’s Chandra X-ray Observatory reveals the hot gas (blue) and cooler gas (reddish-purple). Astronomers can estimate the speed and direction of each cluster's motion — perpendicular to the line of sight — by studying the difference between the average position of the galaxies and the peak in the hot gas. As the filament funnels matter into the cluster, collisions between the gas in two or more clusters causes the hot gas to slow down, dissipating some of its kinetic energy as heat. But the massive and compact galaxies do not slow down as much as the gas does, so they move ahead of it. This allows the researchers to three-dimensionally map the geometry and motion in the system, thereby mapping the large-scale structure of the region located some 5.4 billion light-years from Earth. 3-D Distribution of Dark MatterNASA, ESA, and R. Massey (California Institute of Technology)
Nearly 1,000 hours of Hubble observations similarly enabled an international team of 70 astronomers to create the first three-dimensional map of the web-like, large-scale distribution of dark matter. The map is comprised of 575 slightly overlapping Hubble images that stretch halfway back in time to the beginning of the universe. They reveal a loose network of dark matter filaments, gradually collapsing and growing clumpier over time under the relentless pull of gravity, confirming theories of how structure formed in our evolving universe.
Each slice reveals the changing distribution of dark matter in a discrete epoch of time. Astronomers calibrated each epoch by measuring the cosmological redshift of the lensing galaxies used to map the dark matter’s distribution, placing them into different time/distance "slices." 3-D Distribution of Dark MatterNASA, ESA, and R. Massey (California Institute of Technology)
Astronomers combined the slices to create the three-dimensional map of dark matter over time. The three axes of the box correspond to sky position (right ascension and declination), and distance from Earth increasing from left to right (as measured by cosmological redshift). Note how the dark matter clumping becomes more pronounced, moving right to left across the map, from the early universe to the more recent universe, confirming theories of how the large-scale structure of the universe formed and evolved.
 Cosmic Web and Slime MoldNASA, ESA, and J. Burchett and O. Elek (UC Santa Cruz)
Recently, simple single-cell organisms that feed on dead plant material became the analogous counterpart to how the large-scale structure of the universe formed. Researchers developed an algorithm that mimics the brainless slime mold’s efficiency at building complex filaments to capture new food. They then applied the algorithm to data containing the locations of 37,000 galaxies mapped by the Sloan Digital Sky Survey. The galaxies are analogous to the slime mold’s food. The algorithm revealed the striking similarity between how the slime mold builds complex filaments to capture new food, and how gravity constructs the cosmic web filaments between galaxies and galaxy clusters.
After the three-dimensional computer model estimated the location of the cosmic filaments, the astronomers used archival Hubble observations to detect and study the gas permeating the web at points along those predicted filaments. They examined the ultraviolet light from 350 distant quasars in the Hubble Spectroscopic Legacy Archive. Because these quasars are so far from the galaxies, the researchers were able to use the Hubble data to look for the telltale absorption of undetected hydrogen gas in the spectroscopic signature of the quasars and link the gas to the universe's large-scale structure.
The three sets of paired inset images represent galaxies with yellow dots (left). Next to each galaxy snapshot is an image of the galaxies with the cosmic web's connecting strands in purple (right) superimposed on them.
Learn More

Galaxy Cluster MACS J0717
Using data from NASA's Chandra X-ray Observatory, Hubble Space Telescope, and the Keck Observatory in Hawaii, astronomers determined the three-dimensional geometry and motion in the system MACS J0717.5+3745 (or MACS J0717, for short), located about 5.4 billion light-years from Earth.
Hubble Science Highlights
Discover the breadth and depth of Hubble's exciting discoveries!
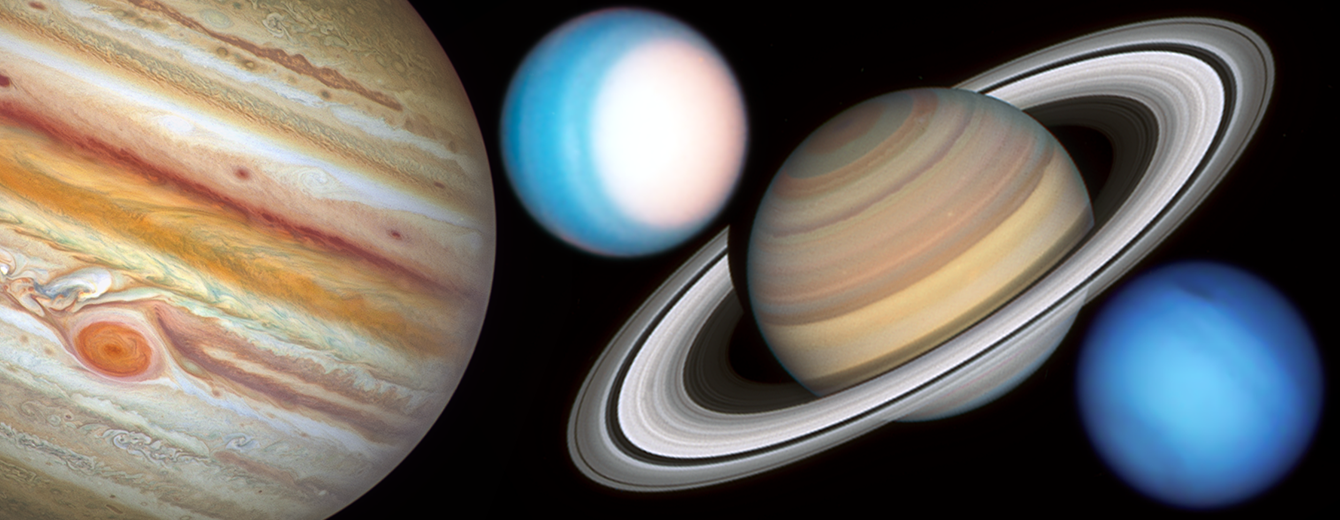
Studying the Planets and Moons
Hubble’s systematic observations chart the ever-changing environments of our solar system's planets and their moons.
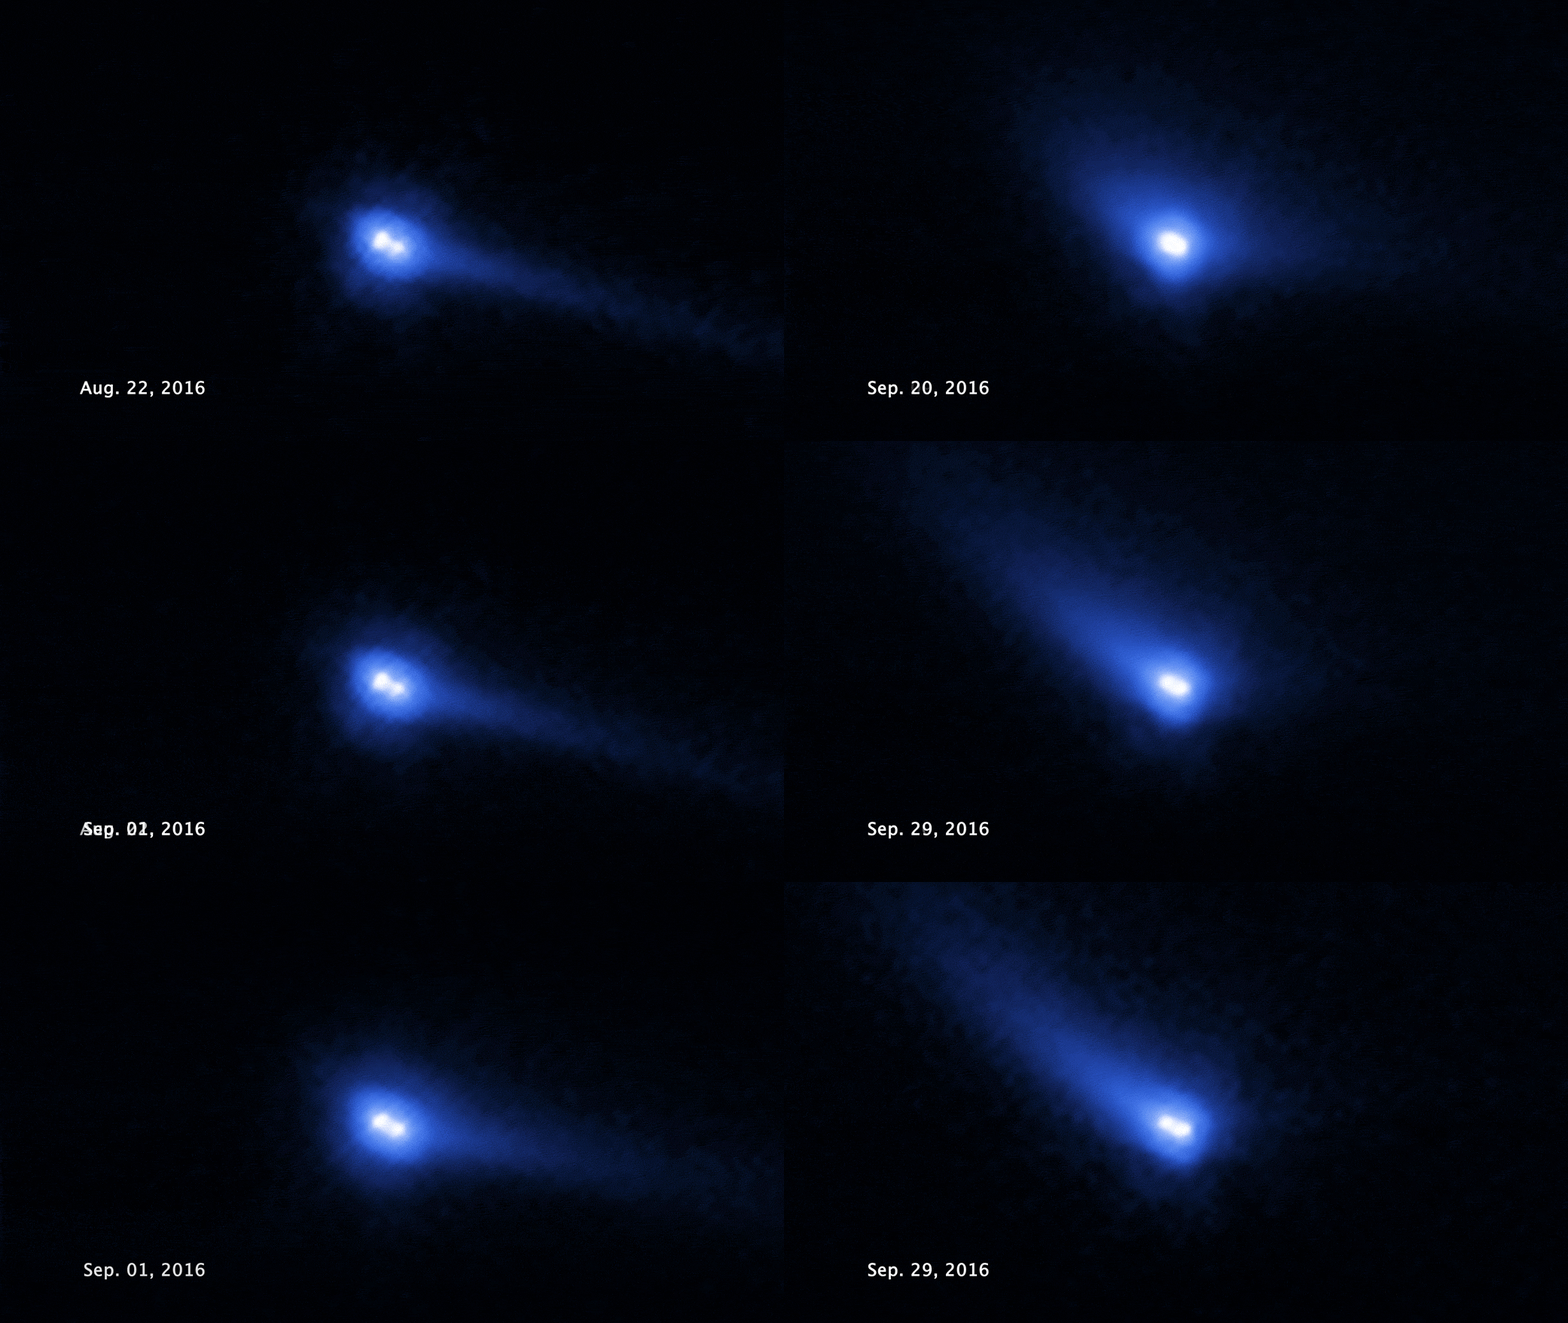
Tracking Evolution in the Asteroid Belt
These conglomerates of rock and ice may hold clues to the early solar system.
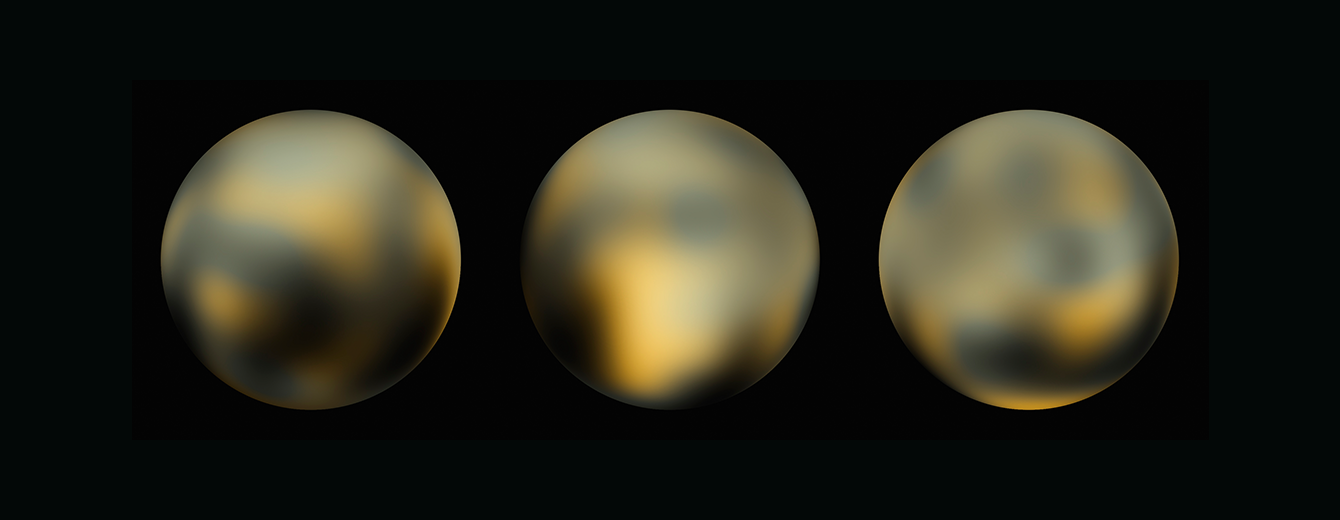
Uncovering Icy Objects in the Kuiper Belt
Hubble’s discoveries helped NASA plan the New Horizon spacecraft’s flyby of Pluto and beyond.
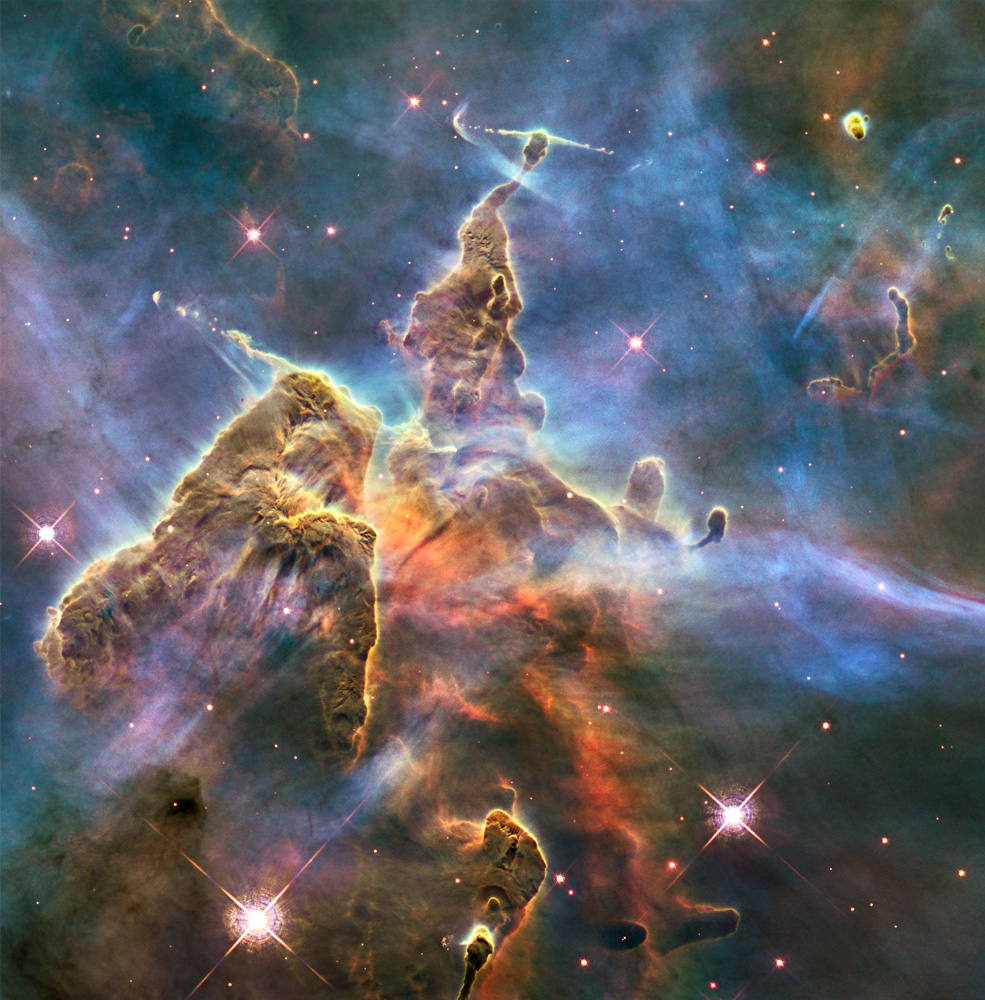
Exploring the Birth of Stars
Seeing ultraviolet, visible, and near-infrared light helps Hubble uncover the mysteries of star formation.
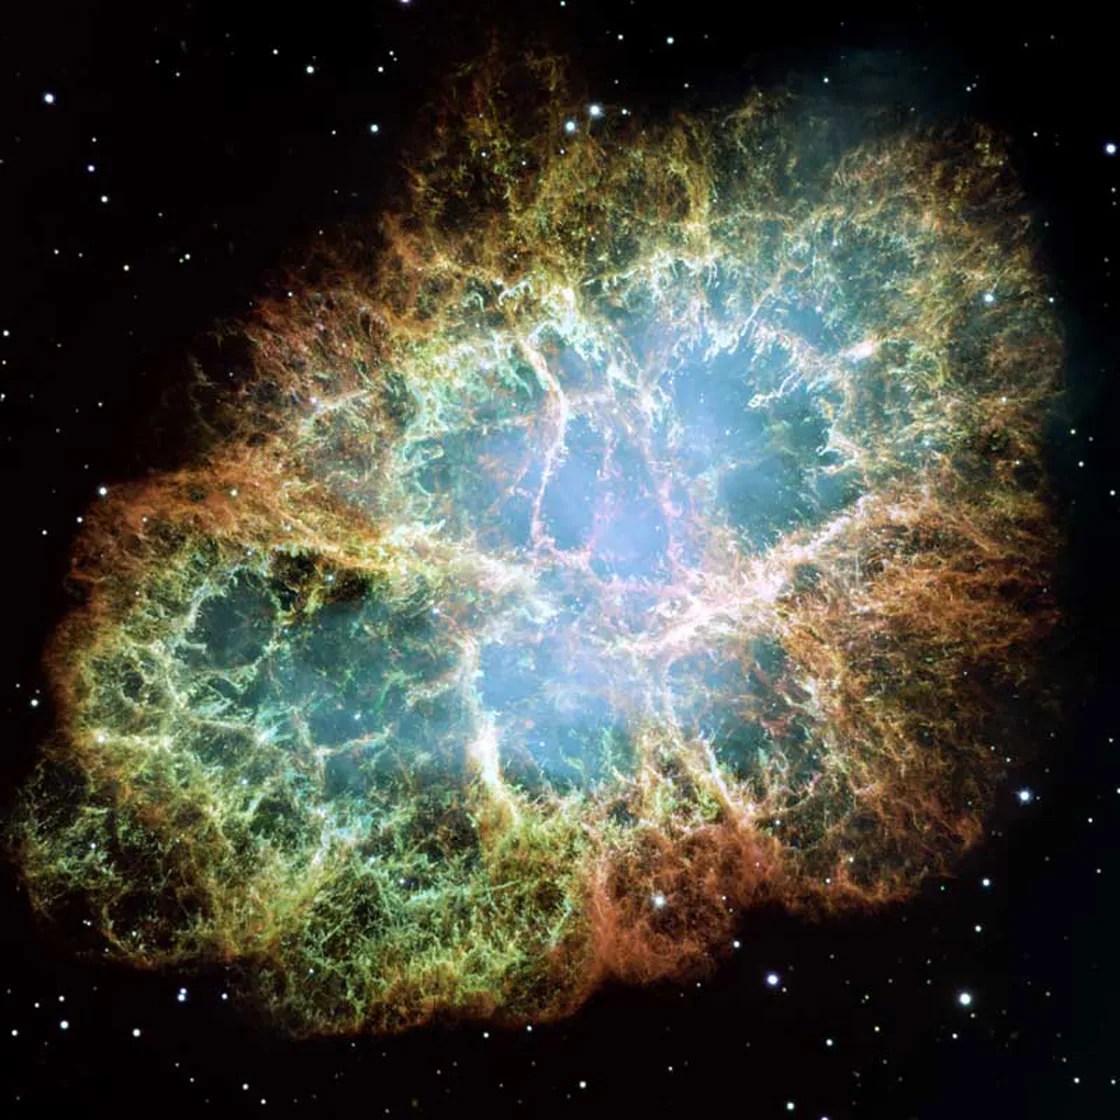
The Death Throes of Stars
When stars die, they throw off their outer layers, creating the clouds that birth new stars.
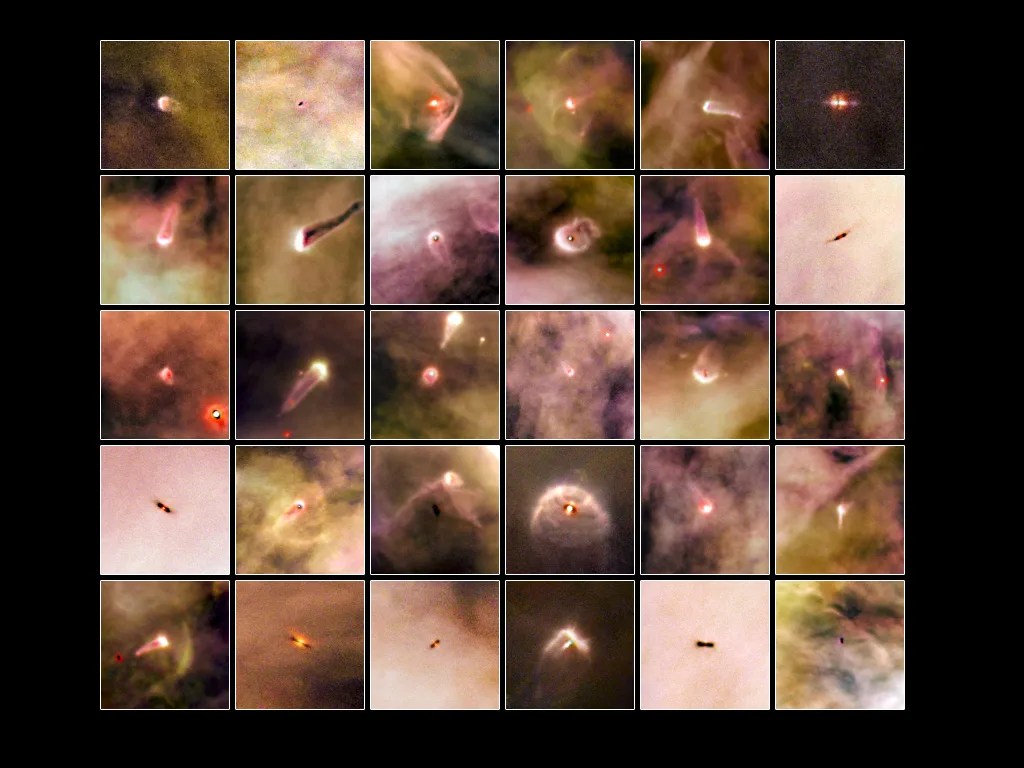
Finding Planetary Construction Zones
Hubble’s sensitivity uncovers the seeds of planets in enormous disks of gas and dust around stars.
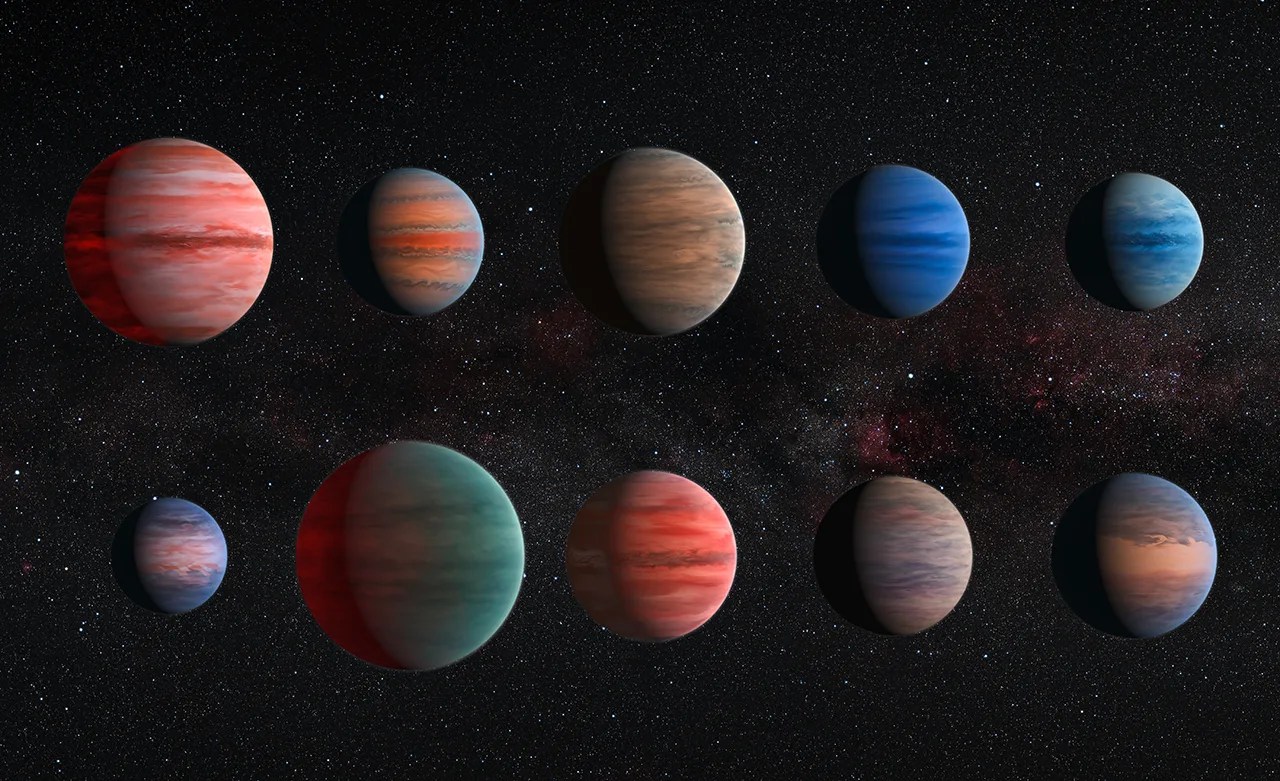
Recognizing Worlds Beyond Our Sun
Hubble can detect and measure the basic organic components for life on planets orbiting other stars
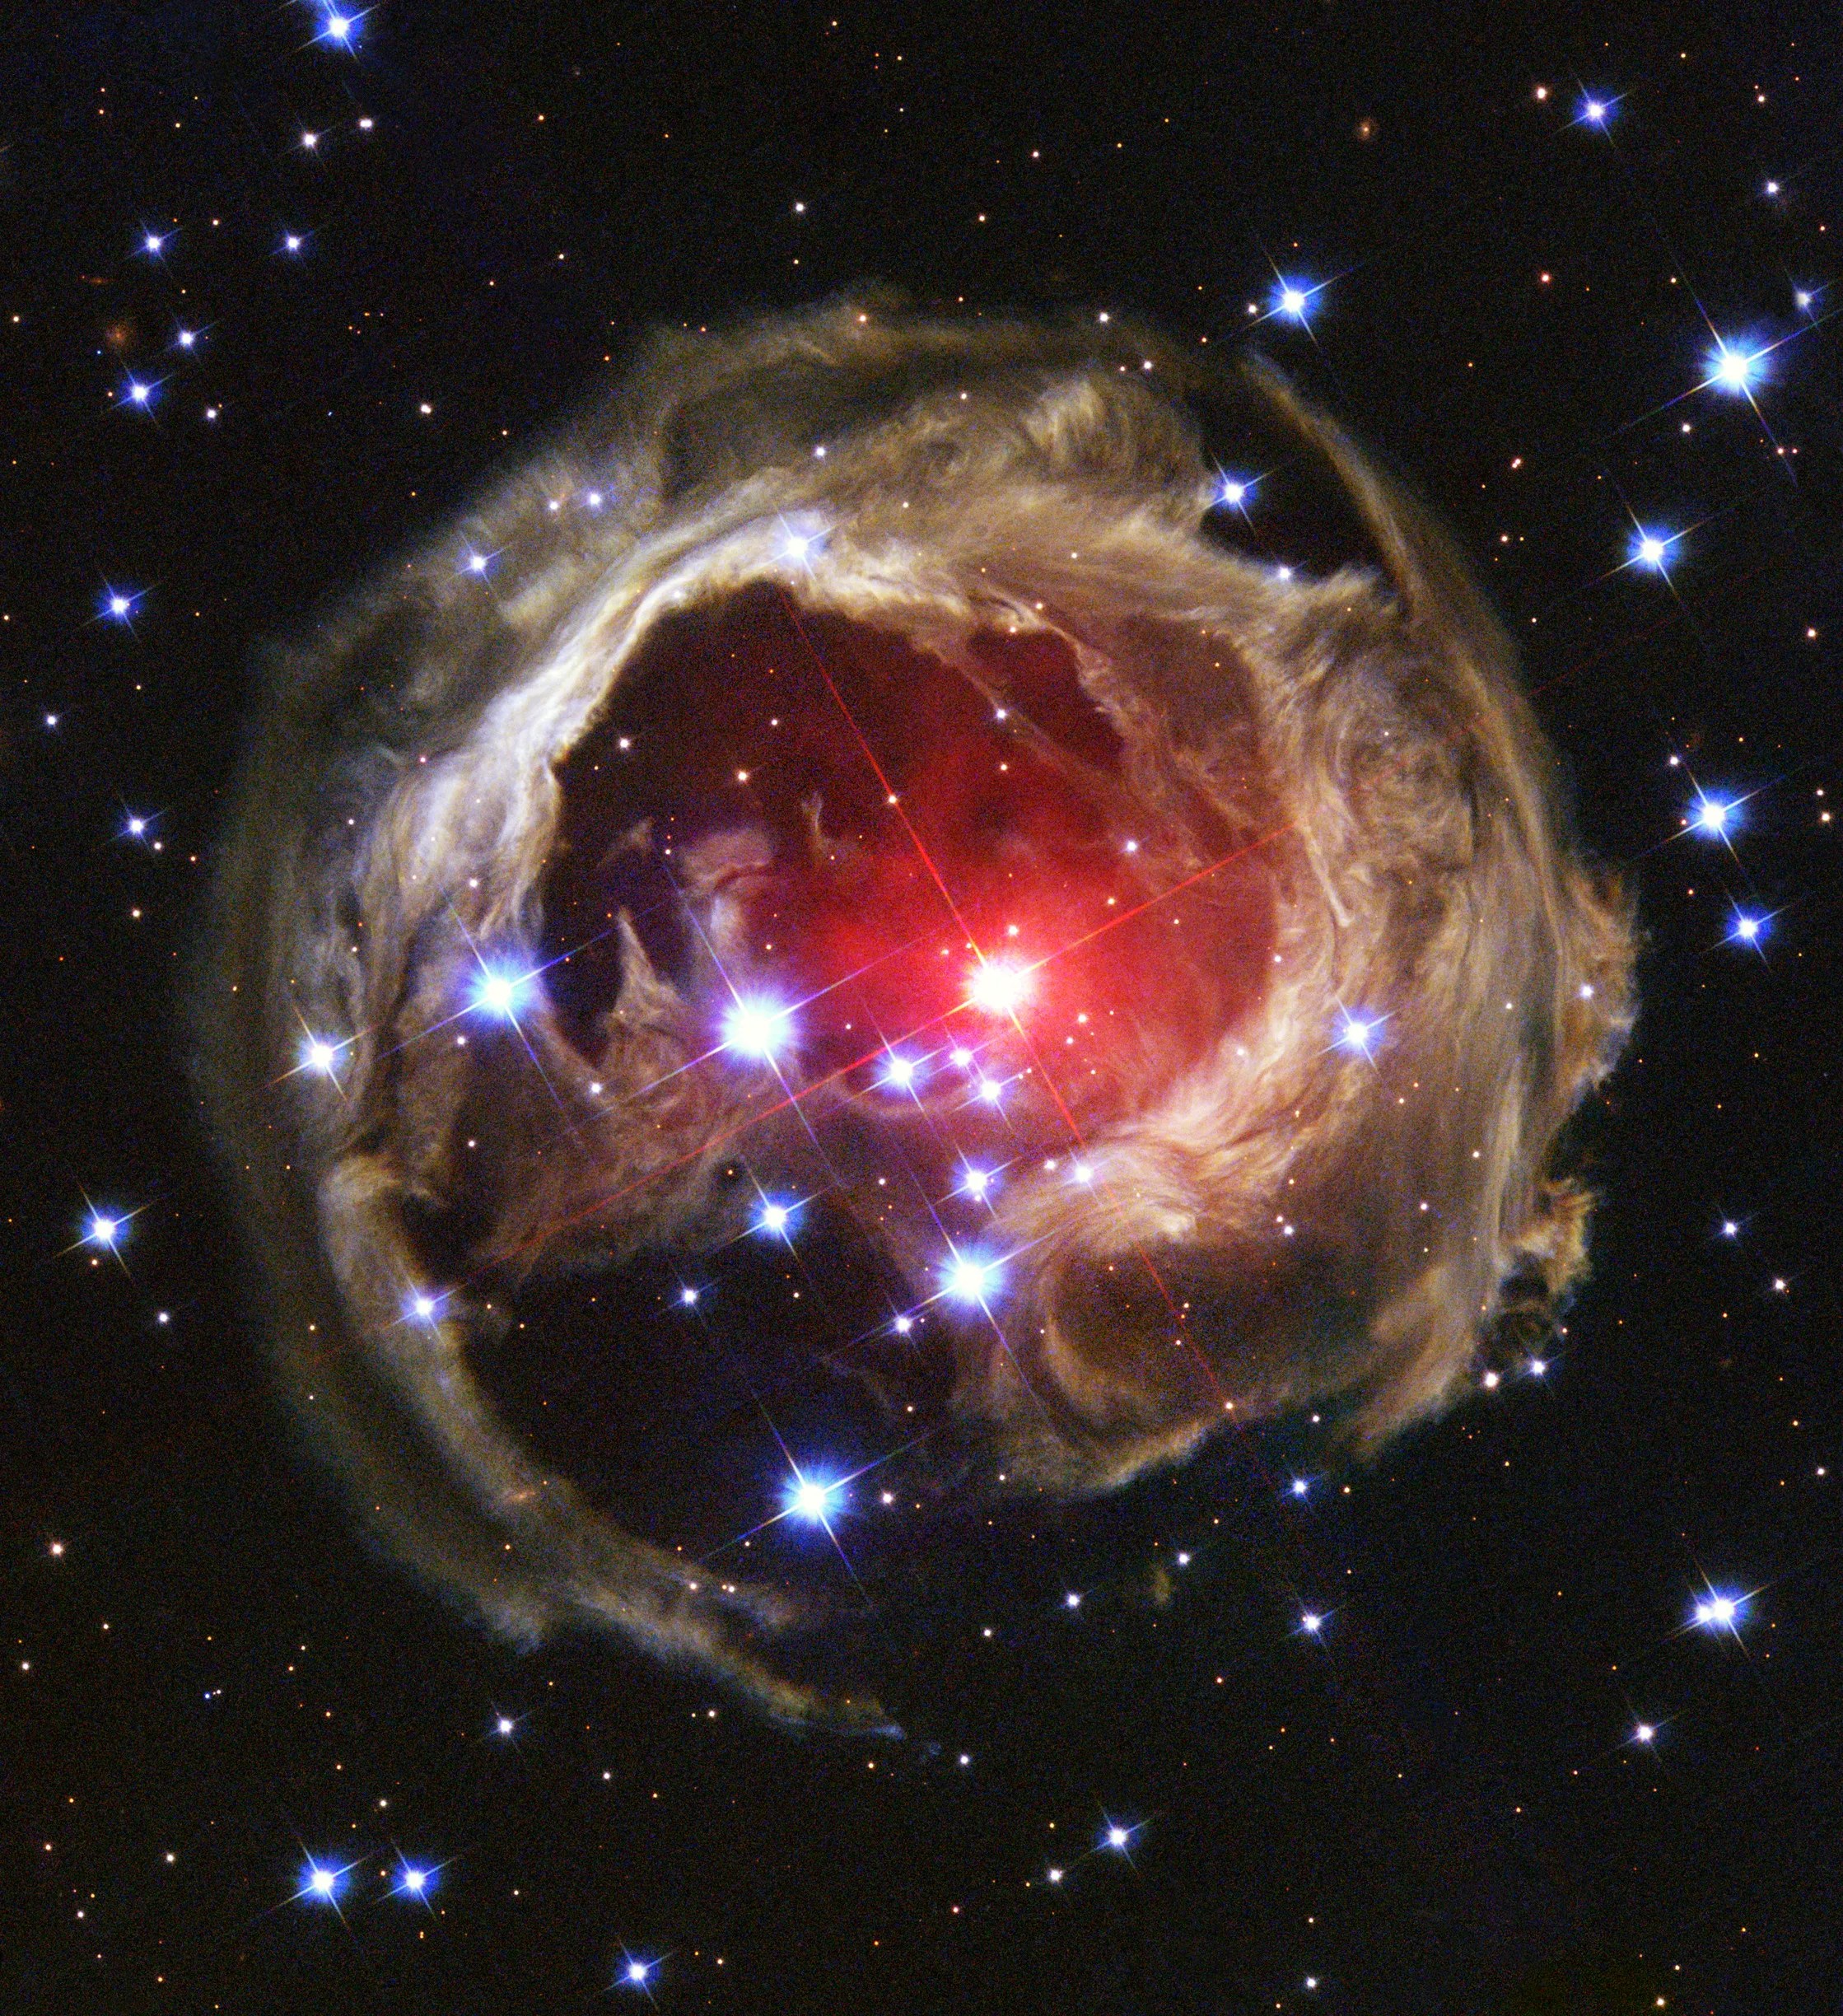
Seeing Light Echoes
Like ripples on a pond, pulses of light reverberate through cosmic clouds forming echoes of light.
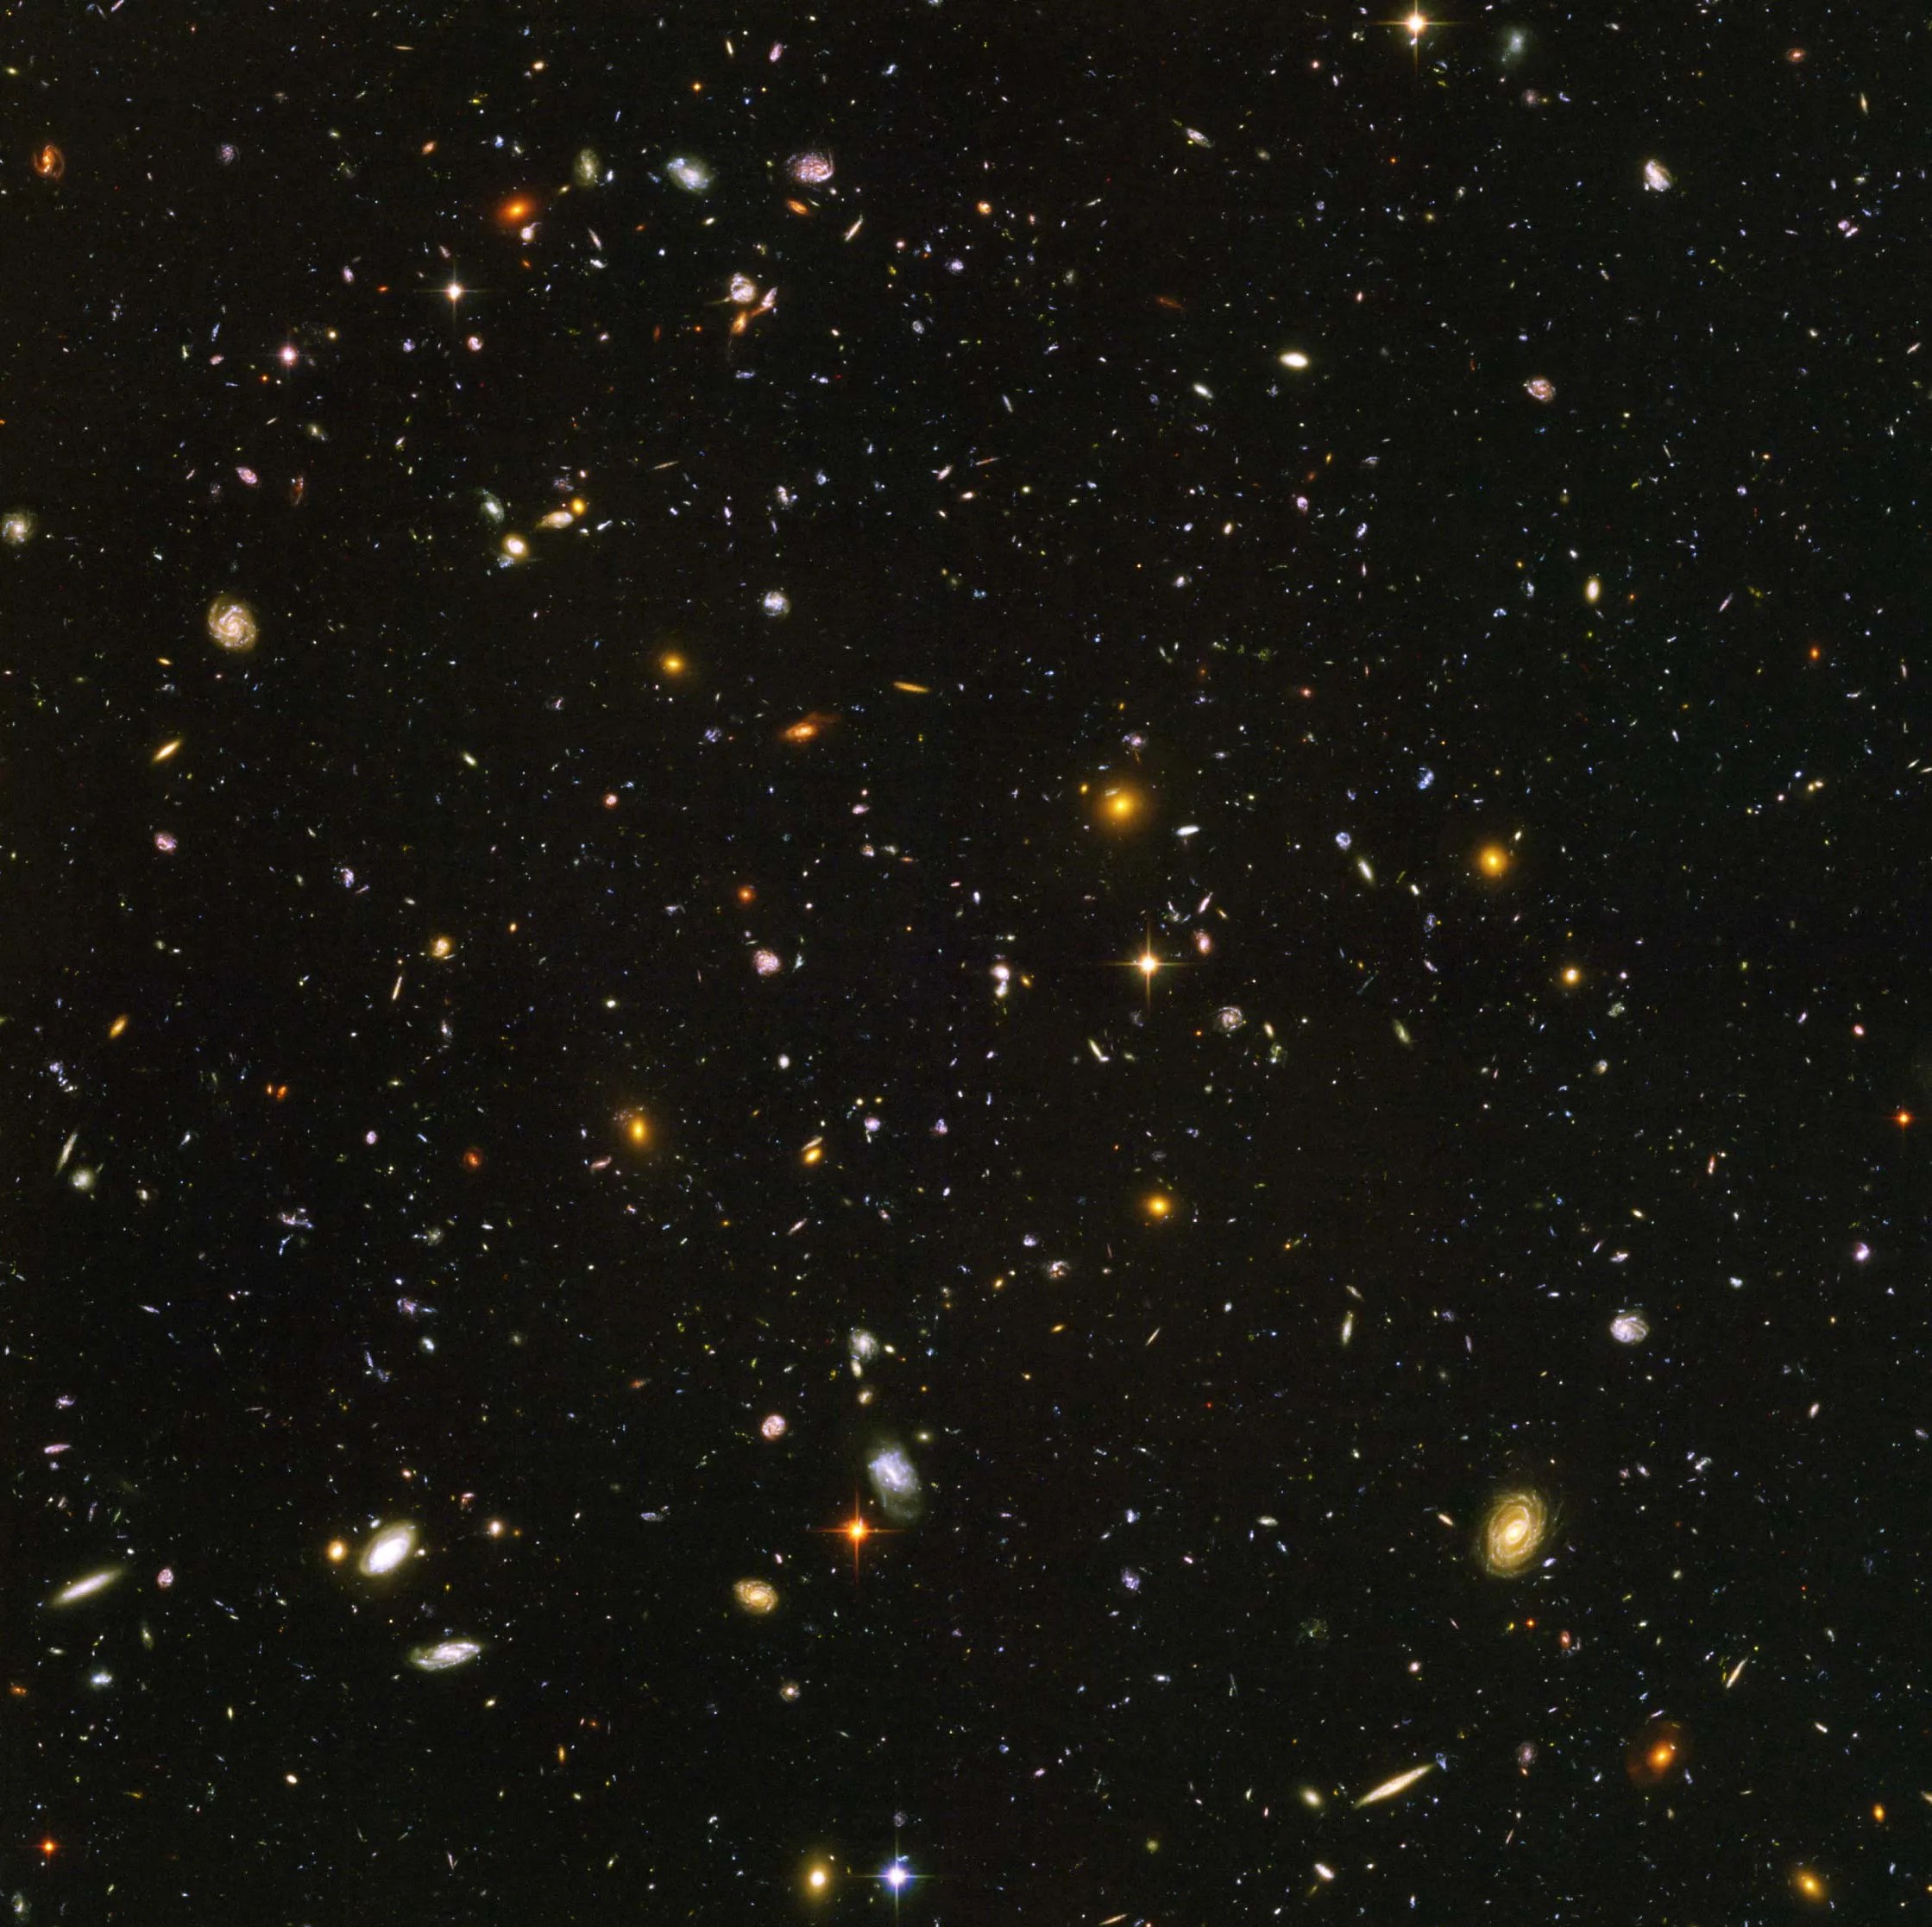
Tracing the Growth of Galaxies
Hubble's Deep Field observations are instrumental in tracing the growth of galaxies.
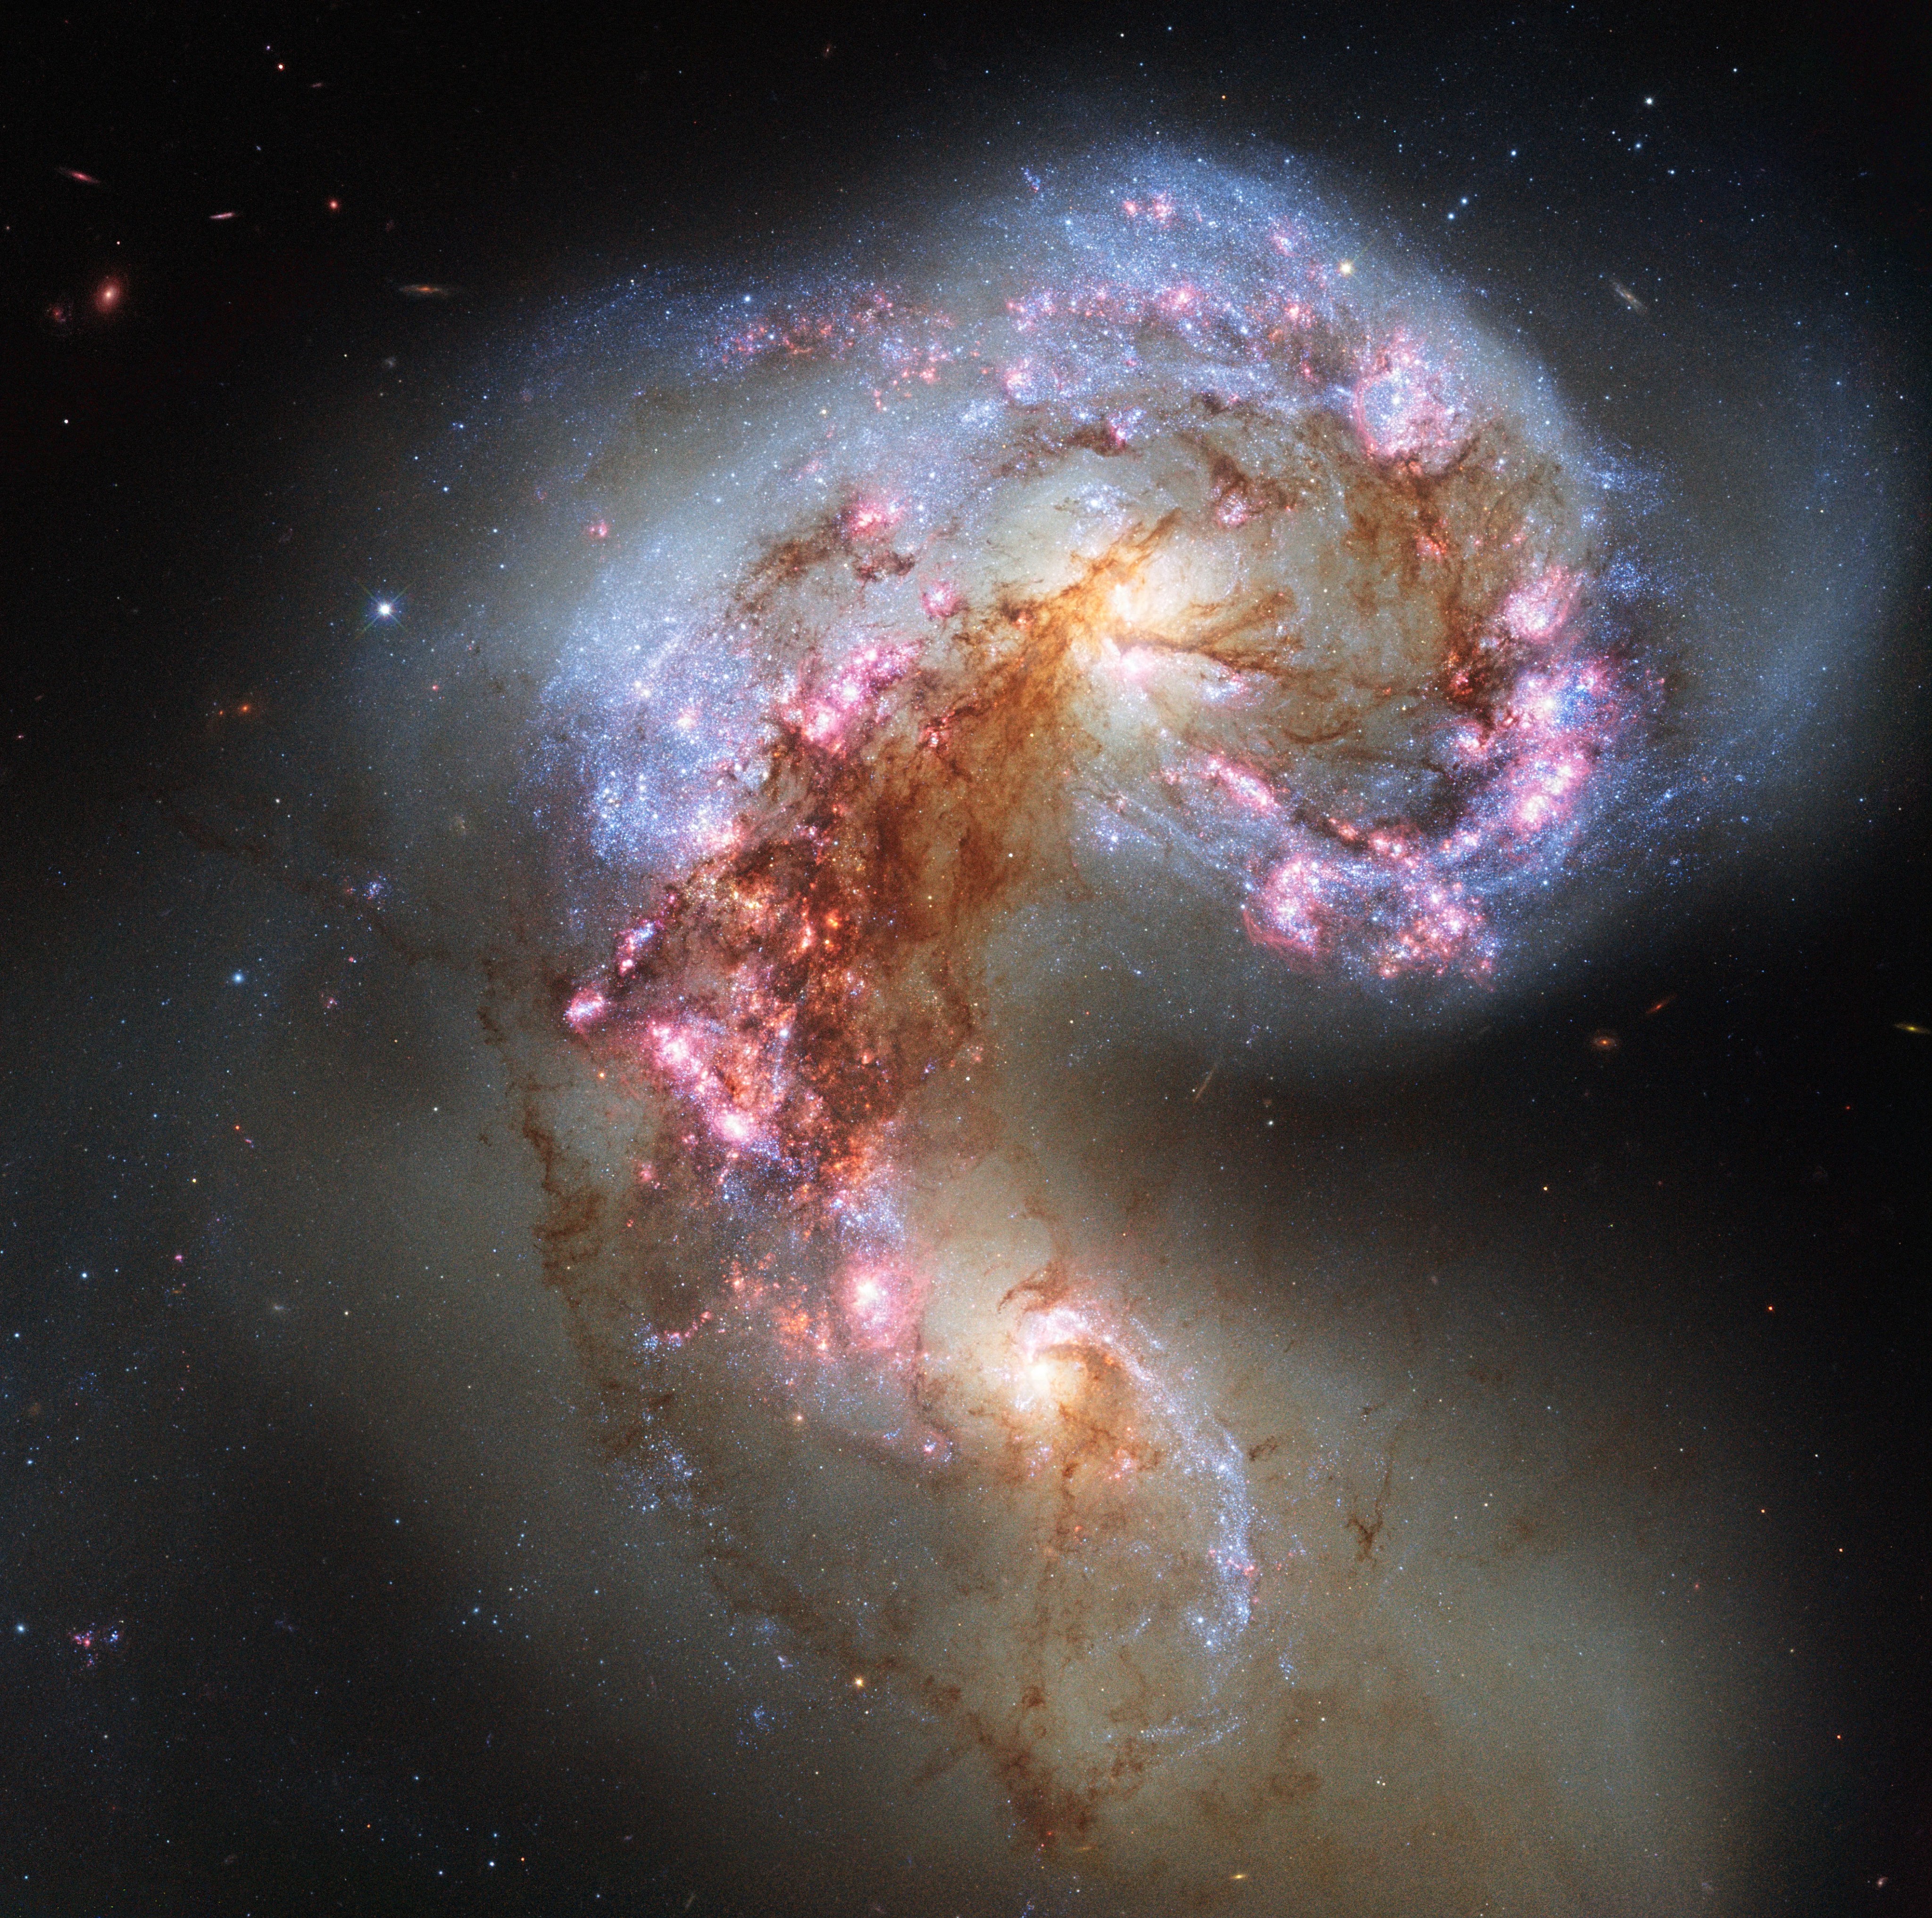
Galaxy Details and Mergers
Galaxies evolve through gravitational interaction with their neighbors, creating a menagerie of forms.
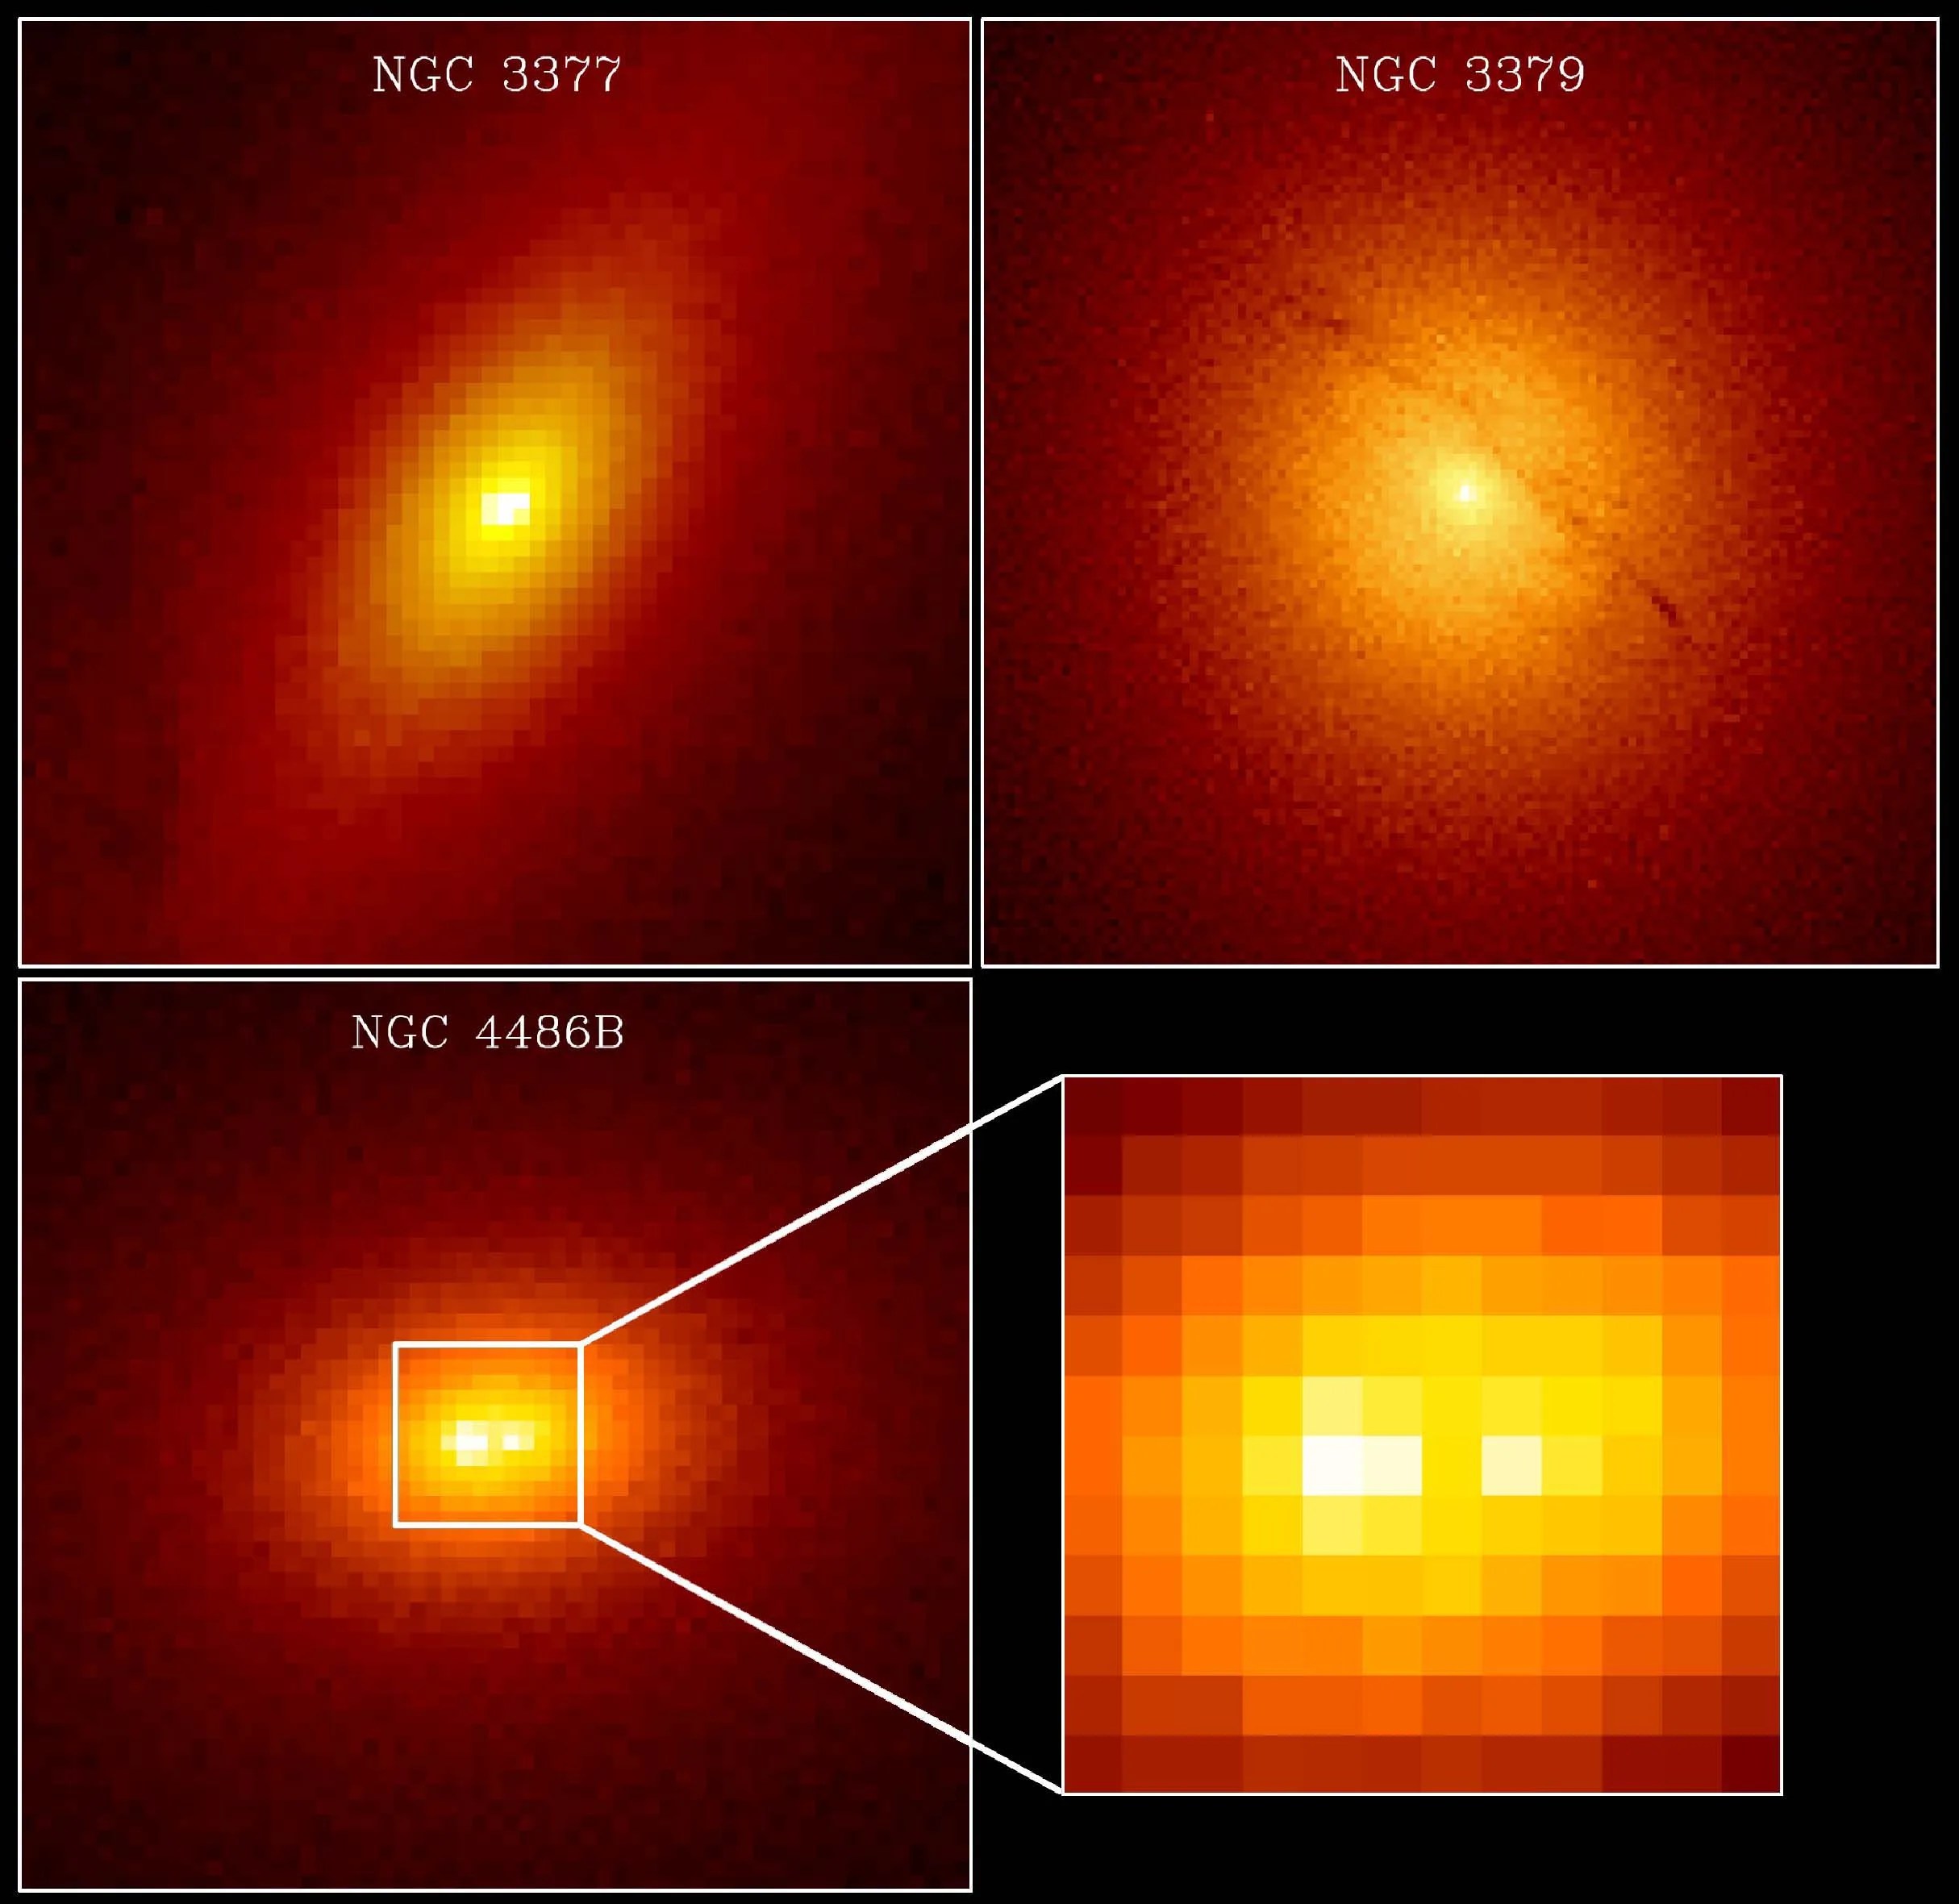
Monster Black Holes are Everywhere
Supermassive black holes lie at the heart of nearly every galaxy.

Homing in on Cosmic Explosions
Hubble helps astronomers better understand and define some of the largest explosions in the universe.
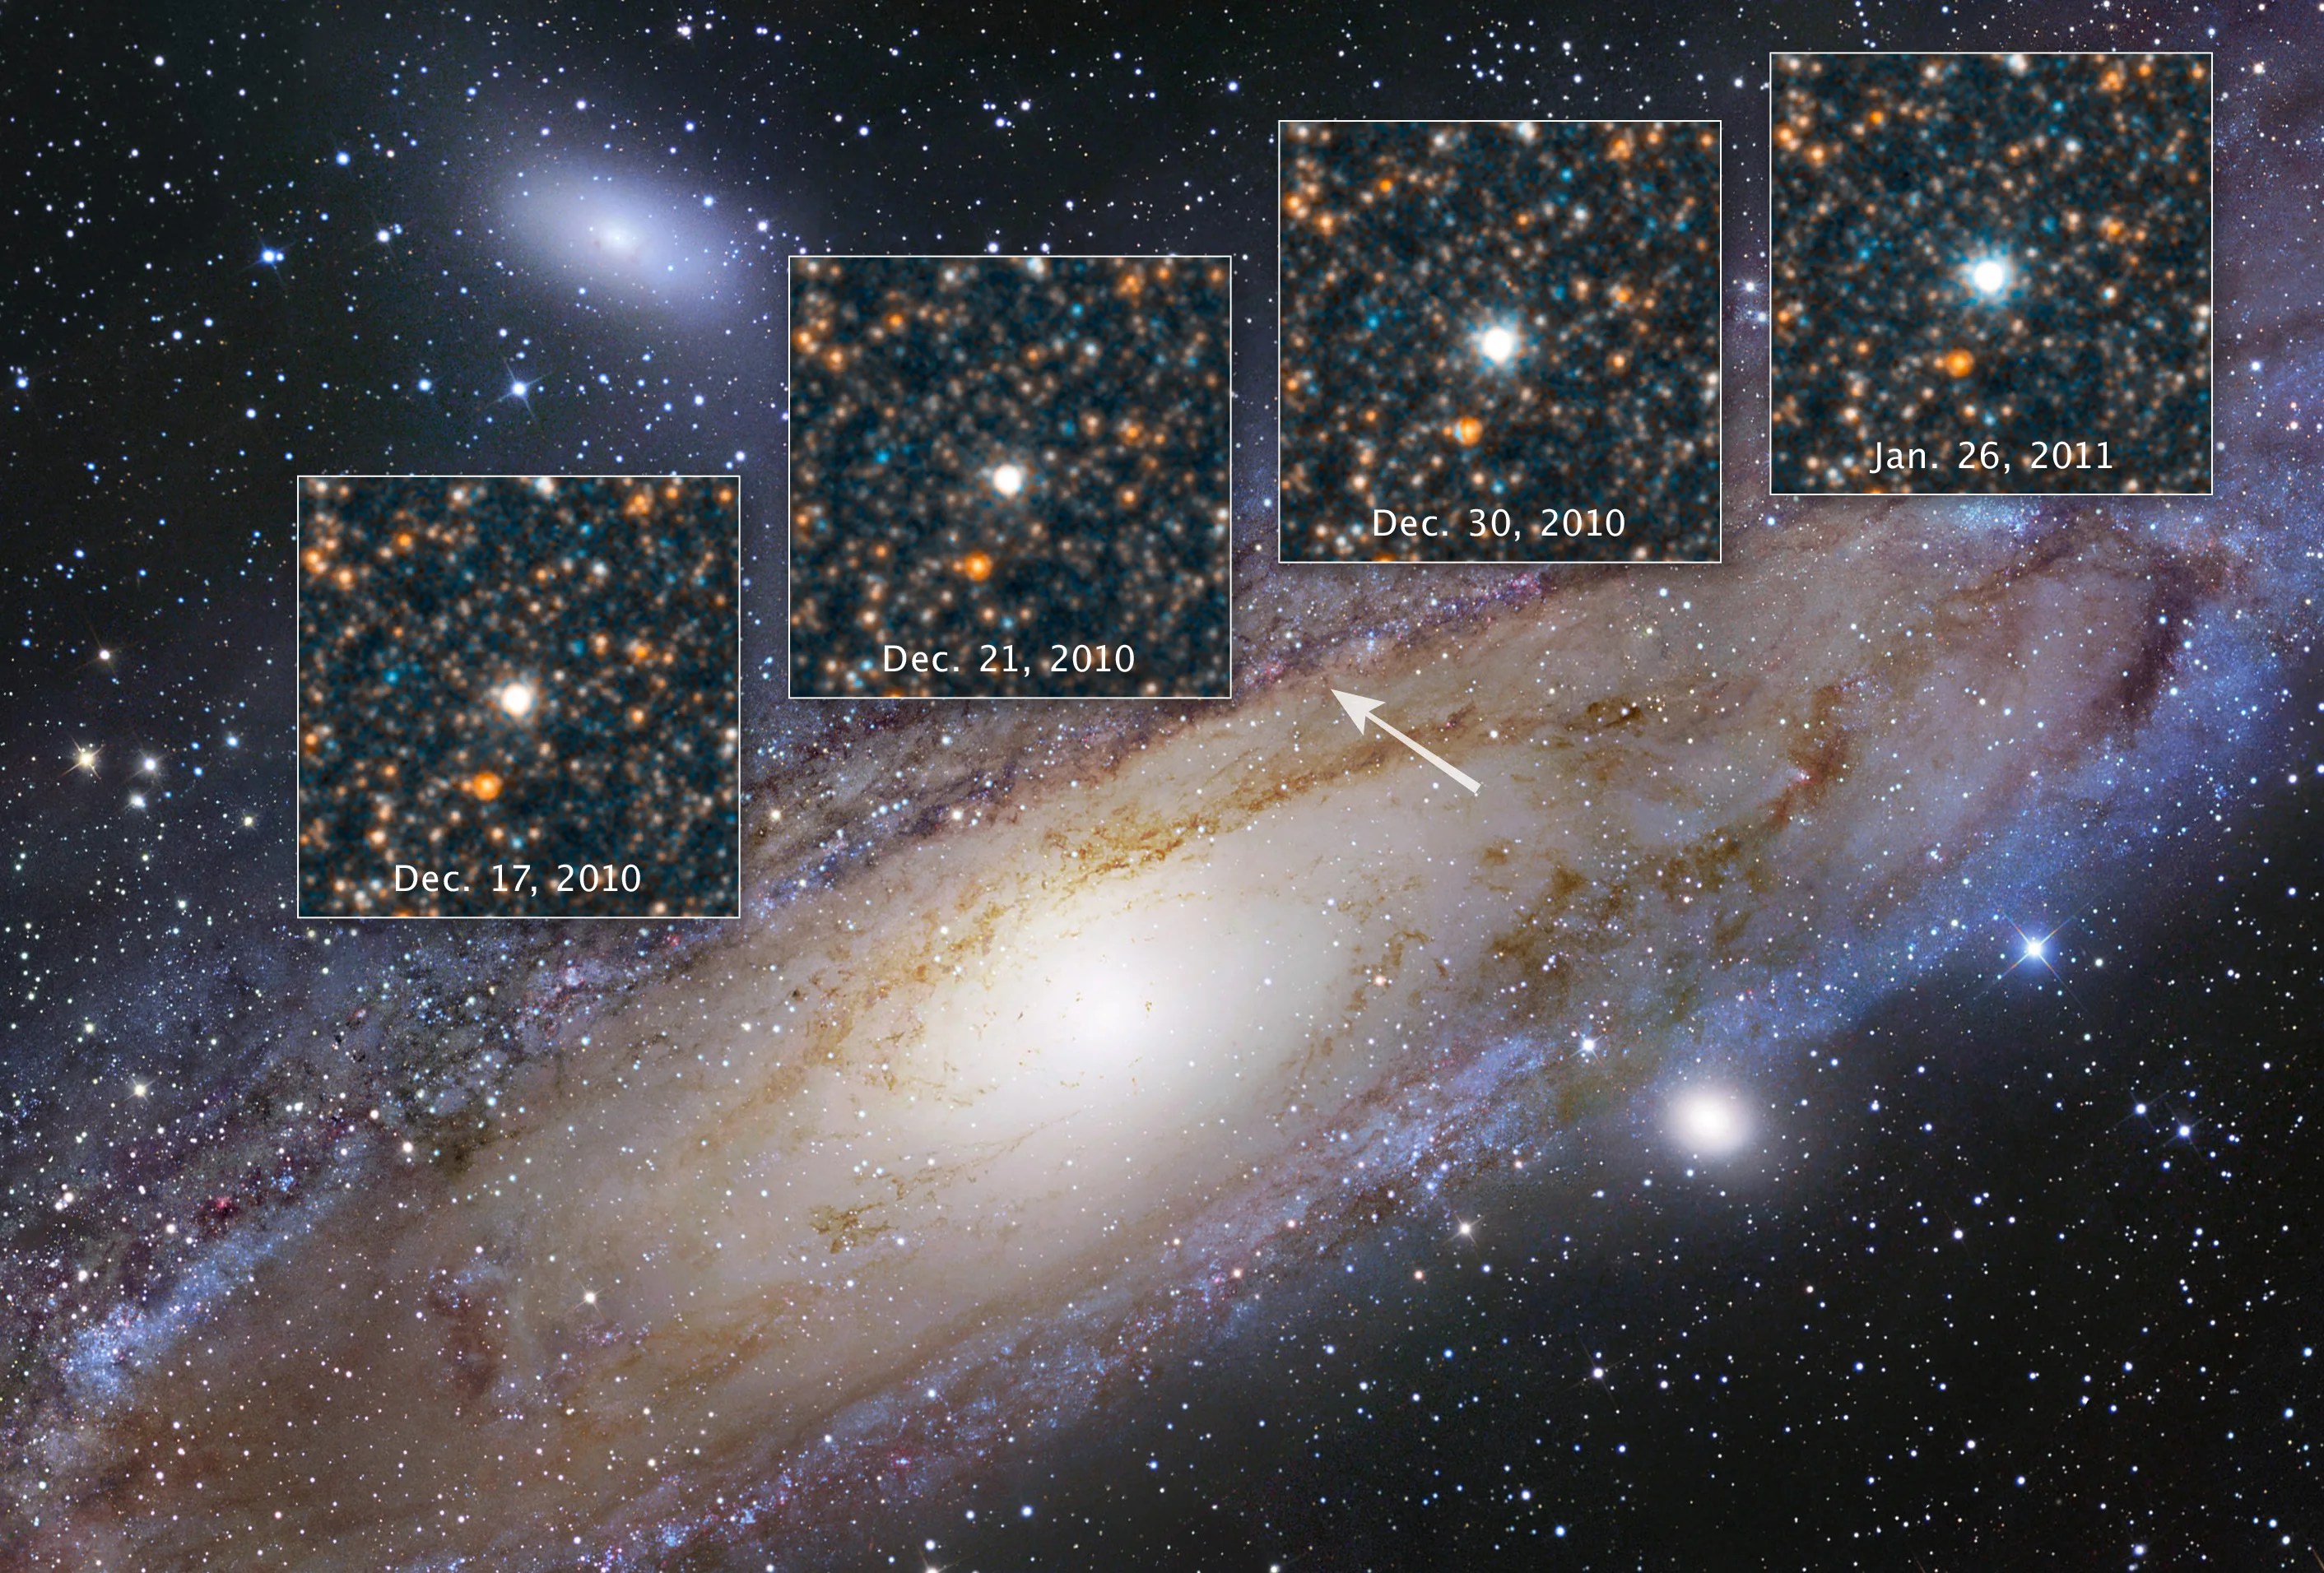
Discovering the Runaway Universe
Our cosmos is growing, and that expansion rate is accelerating.

Focusing in on Gravitational Lenses
Gravitational lenses are 'Nature's Boost', expanding our view deeper into space and farther back in time.
Shining a Light on Dark Matter
The gravitational pull of dark matter guides the formation of everything we can see in the universe.


